Fig. 5.
Download original image
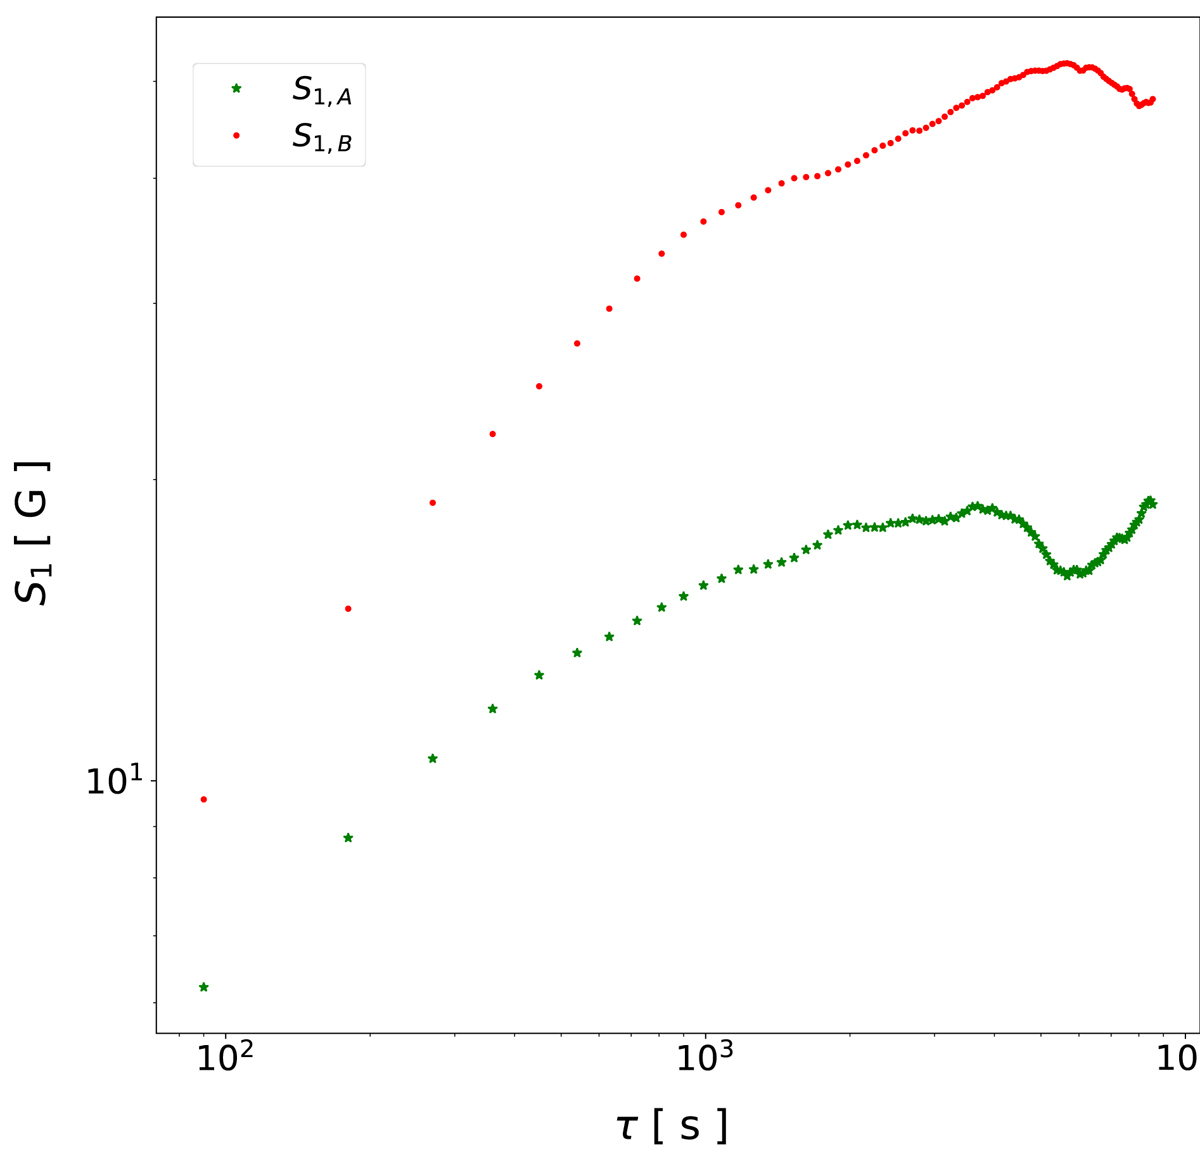
Log–log plot of structure function of order 1 as a function of the timescale τ for the pixels A and B identified in the right panel of Fig. 1. Green stars mark S1, A, while red dots mark S1, B. Standard errors associated with the values of the structure function at any τ are smaller than the symbols used, and are therefore not visible in this representation.
Current usage metrics show cumulative count of Article Views (full-text article views including HTML views, PDF and ePub downloads, according to the available data) and Abstracts Views on Vision4Press platform.
Data correspond to usage on the plateform after 2015. The current usage metrics is available 48-96 hours after online publication and is updated daily on week days.
Initial download of the metrics may take a while.