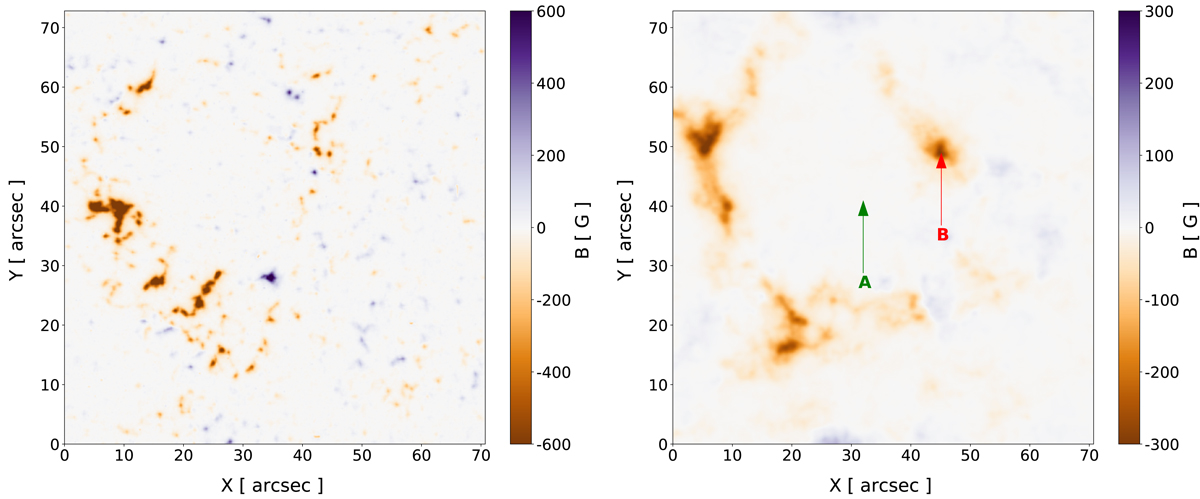
Fig. 1.
Download original image
Left panel: first frame of the magnetogram time-series acquired on 2010 November 2 at 08:00:42 UT, saturated between −600 G and 600 G; Right panel: mean magnetogram averaged over the entire magnetogram time-series (∼24 h) saturated between −300 G and 300 G. The green and red arrows point to two pixels belonging to inner (A) and boundary (B) regions of the supergranule, respectively.
Current usage metrics show cumulative count of Article Views (full-text article views including HTML views, PDF and ePub downloads, according to the available data) and Abstracts Views on Vision4Press platform.
Data correspond to usage on the plateform after 2015. The current usage metrics is available 48-96 hours after online publication and is updated daily on week days.
Initial download of the metrics may take a while.