Fig. 6.
Download original image
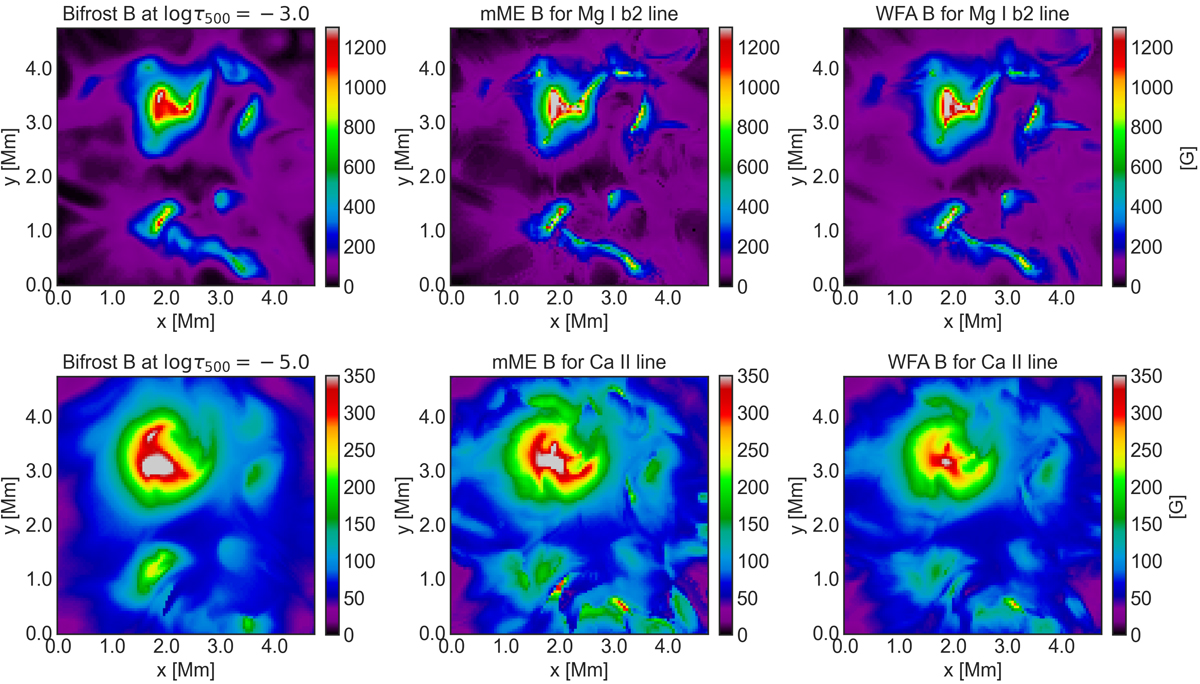
Maps of the magnetic field strength in the region of interest from the Bifrost simulation (left panels), from the mME approximation (central panels), and from the WFA (right panels); and for the Mg I b2 line (top) and for the Ca II 854.2 nm (bottom). The maps in the left panels are taken at the estimated optical depths according to the mME inversion results (log τ500 = −3.0 for Mg I b2 and log τ500 = −5.0 for Ca II).
Current usage metrics show cumulative count of Article Views (full-text article views including HTML views, PDF and ePub downloads, according to the available data) and Abstracts Views on Vision4Press platform.
Data correspond to usage on the plateform after 2015. The current usage metrics is available 48-96 hours after online publication and is updated daily on week days.
Initial download of the metrics may take a while.