Fig. 5.
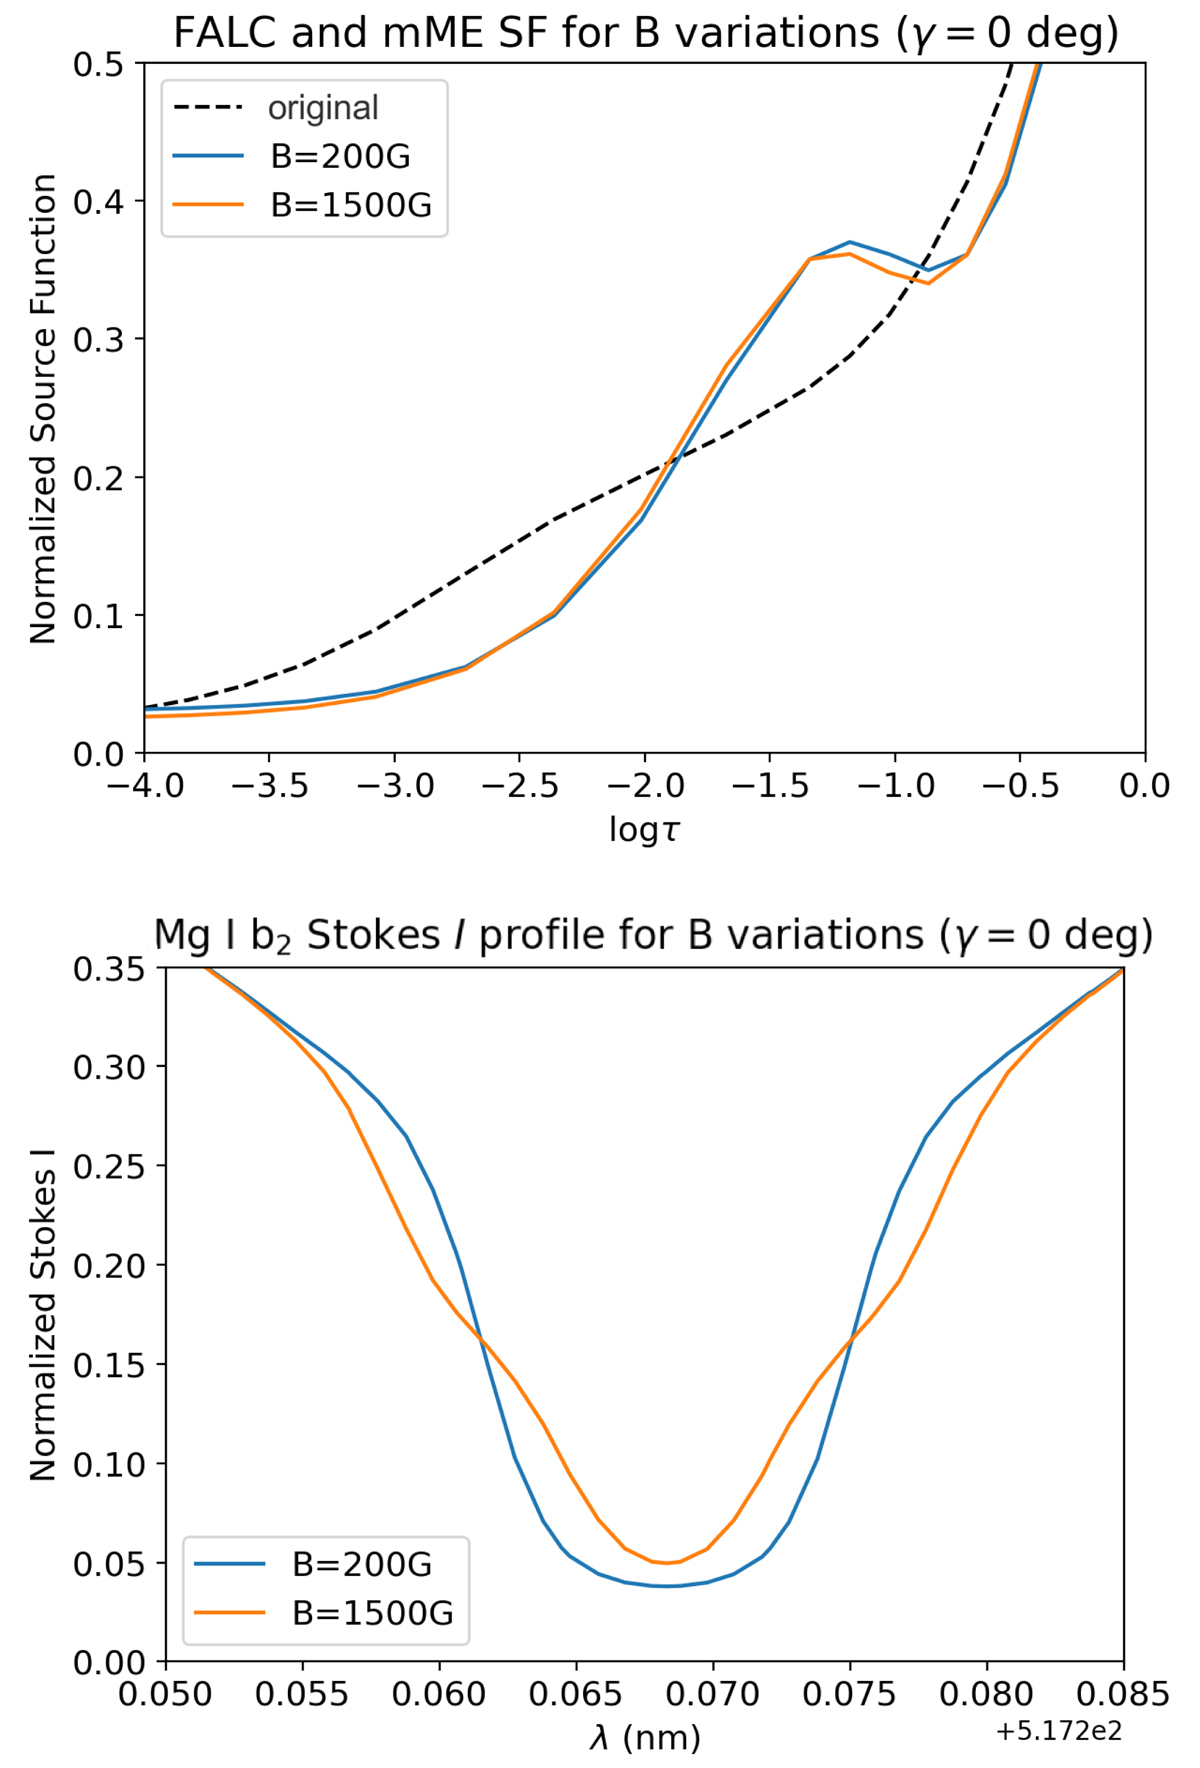
Download original image
mME inferred source functions (top) and associated intensity profiles (bottom) corresponding to the lowest (200 G; blue line) and the highest (1500 G; orange line) values of the magnetic field strengths added to the FALC model atmosphere. Dashed line in the top panel corresponds to the original source function calculated with the RH code. Bottom panel: only shows the line core.
Current usage metrics show cumulative count of Article Views (full-text article views including HTML views, PDF and ePub downloads, according to the available data) and Abstracts Views on Vision4Press platform.
Data correspond to usage on the plateform after 2015. The current usage metrics is available 48-96 hours after online publication and is updated daily on week days.
Initial download of the metrics may take a while.