Free Access
Fig. 1.
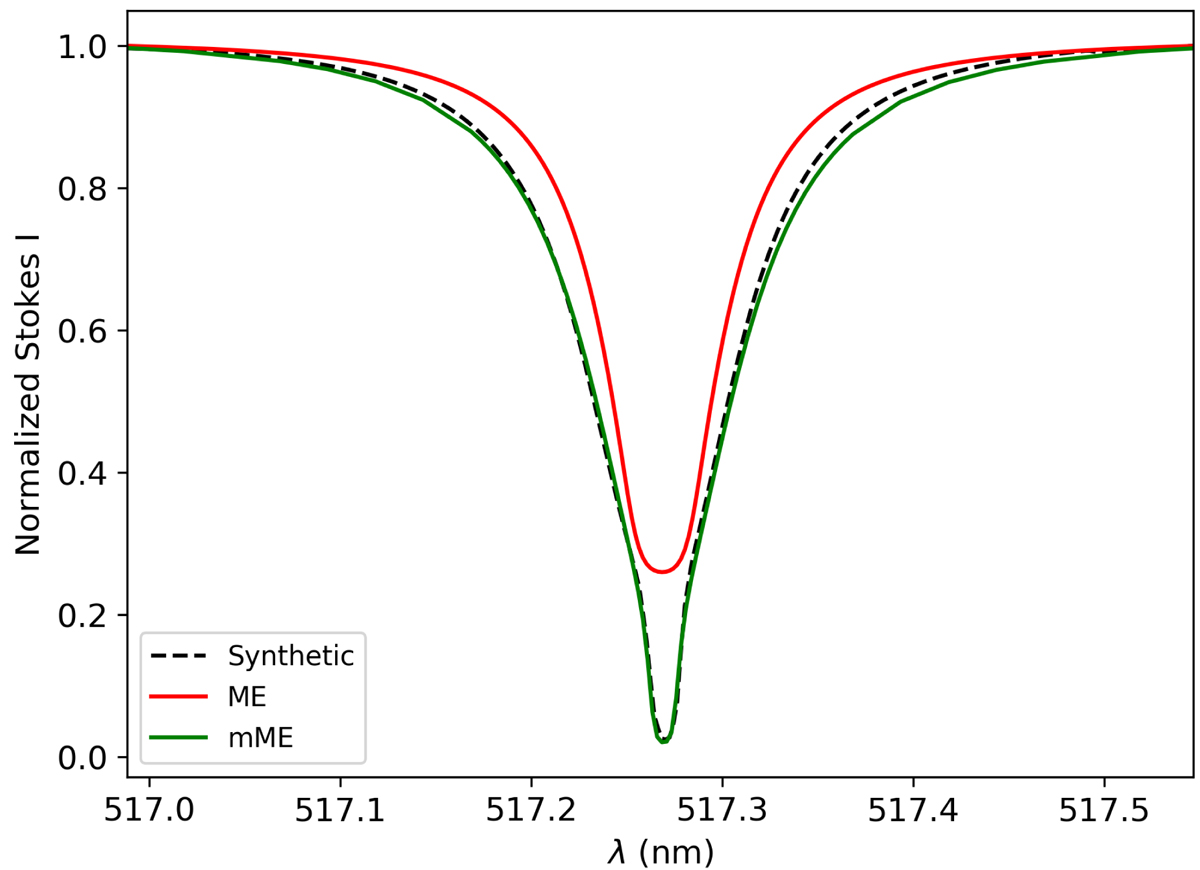
Download original image
Normalized Stokes I profile corresponding to the Mg I b2 spectral line at 517.2 nm. The dashed line corresponds to the synthetic profile generated from MHD simulations (see Sect. 4), while the solid red and green lines correspond to the ME and mME fitted profiles, respectively, with model parameters listed in Table 1.
Current usage metrics show cumulative count of Article Views (full-text article views including HTML views, PDF and ePub downloads, according to the available data) and Abstracts Views on Vision4Press platform.
Data correspond to usage on the plateform after 2015. The current usage metrics is available 48-96 hours after online publication and is updated daily on week days.
Initial download of the metrics may take a while.