Fig. 4.
Download original image
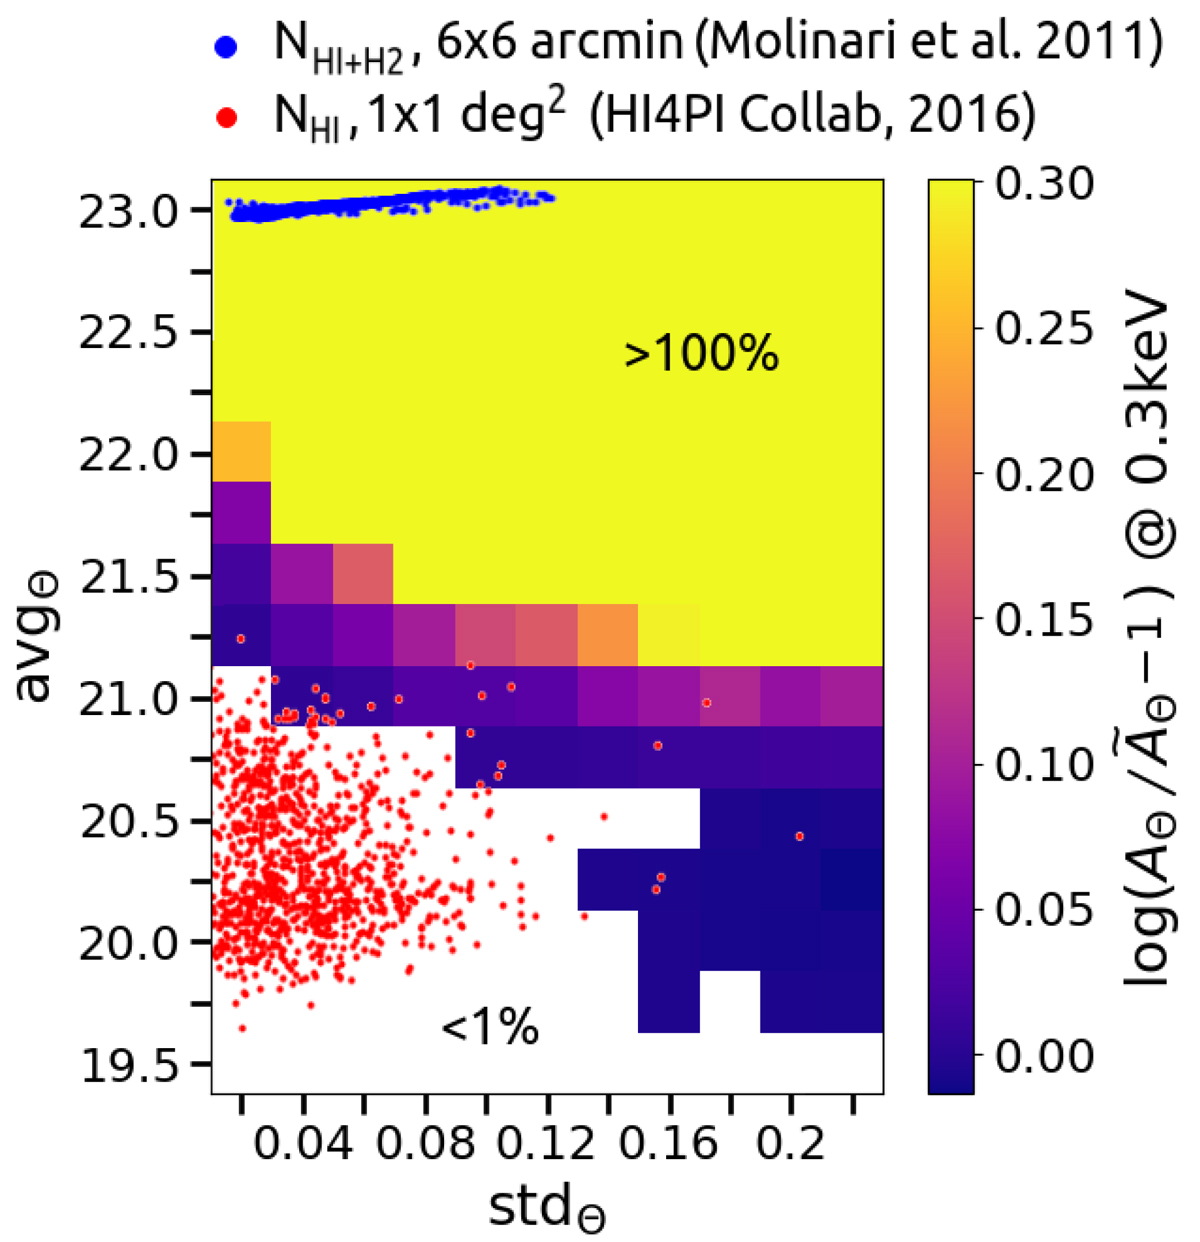
Percent deviation ![]() (log scale) between the absorption at 0.3 keV produced by a lognormal distribution of column densities and a single-parameter absorption model (i.e., tbabs
(NH = avgΘ)) as a function of the free parameters avgΘ and stdΘ. Blue and red points show the scatter plot for distributions extracted from 6′×6′ random regions in the Galactic center column density map (Molinari et al. 2011) and 1deg × 1deg random region at Galactic latitudes b > 10deg from the HI column densities of HI4PI Collaboration (2016), respectively.
(log scale) between the absorption at 0.3 keV produced by a lognormal distribution of column densities and a single-parameter absorption model (i.e., tbabs
(NH = avgΘ)) as a function of the free parameters avgΘ and stdΘ. Blue and red points show the scatter plot for distributions extracted from 6′×6′ random regions in the Galactic center column density map (Molinari et al. 2011) and 1deg × 1deg random region at Galactic latitudes b > 10deg from the HI column densities of HI4PI Collaboration (2016), respectively.
Current usage metrics show cumulative count of Article Views (full-text article views including HTML views, PDF and ePub downloads, according to the available data) and Abstracts Views on Vision4Press platform.
Data correspond to usage on the plateform after 2015. The current usage metrics is available 48-96 hours after online publication and is updated daily on week days.
Initial download of the metrics may take a while.