Fig. 3.
Download original image
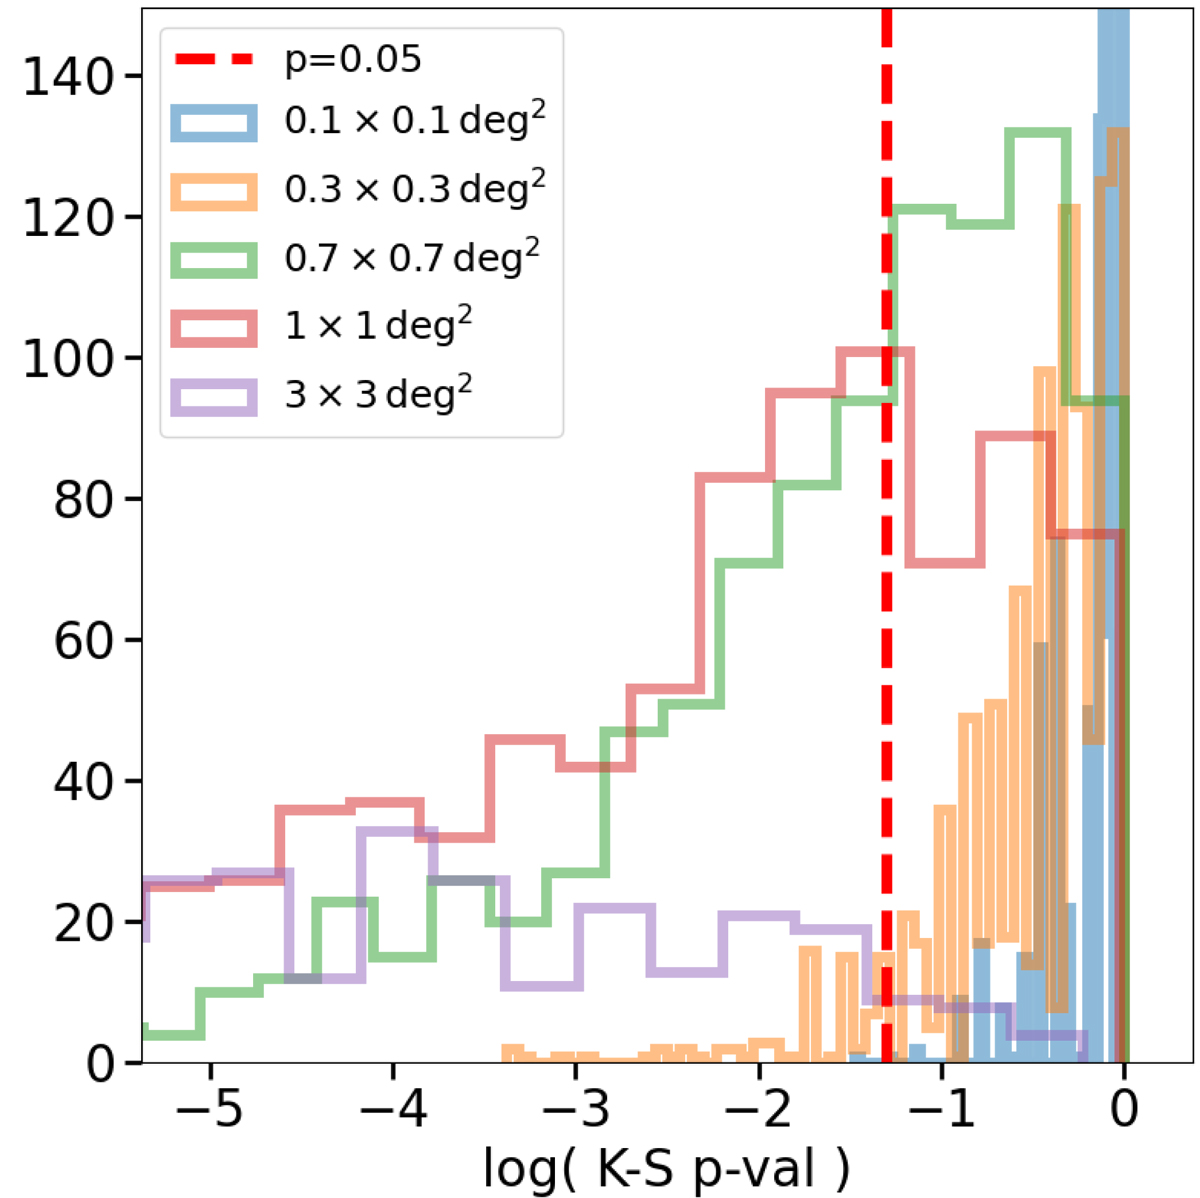
Goodness of the approximation with a lognormal distribution in terms of Kolmogorov-Smirnov p-value distributions (log10 scale). The vertical red line shows pKS = 0.05. The Kolmogorov-Smirnov test is run over column density sets extracted from a circular region of different areas in the NH all sky maps of HI4PI Collaboration (2016).
Current usage metrics show cumulative count of Article Views (full-text article views including HTML views, PDF and ePub downloads, according to the available data) and Abstracts Views on Vision4Press platform.
Data correspond to usage on the plateform after 2015. The current usage metrics is available 48-96 hours after online publication and is updated daily on week days.
Initial download of the metrics may take a while.