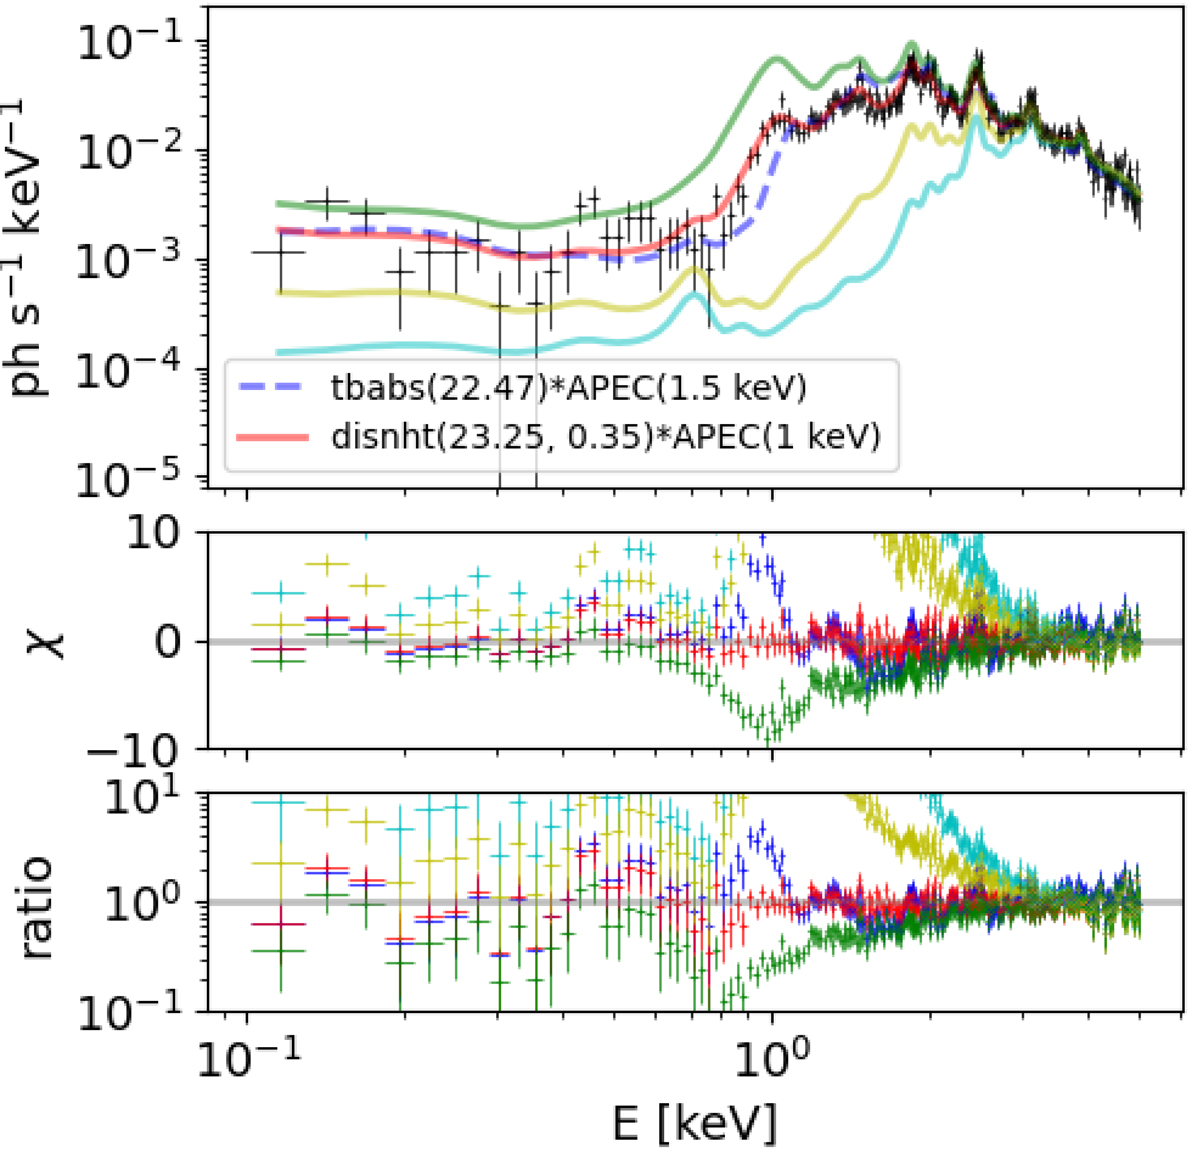
Fig. 2.
Download original image
Simulated spectrum absorbed by a lognormal distribution of column densities. The emission model is an APEC at T = 1 keV and solar abundances (Lodders 2003). The mock data are the sum of 100 simulated APEC absorbed by different column density values of the neutral material extracted from a lognormal distribution. The solid lines show disnht models with avgΘ values: 23.25 (best fit) and different stdΘ 0.50 (green), 0.33 (red, best fit), 0.20 (yellow), and 0.01 (cyan). The dashed blue line show the same emission model absorbed by a single column density equal to avgΘ = 23.25 (with best-fit kT = 1.5 keV). Residuals χ ≡ (data − model)/error and ratios data/model are shown in the central and lower panel, respectively.
Current usage metrics show cumulative count of Article Views (full-text article views including HTML views, PDF and ePub downloads, according to the available data) and Abstracts Views on Vision4Press platform.
Data correspond to usage on the plateform after 2015. The current usage metrics is available 48-96 hours after online publication and is updated daily on week days.
Initial download of the metrics may take a while.