Fig. 1.
Download original image
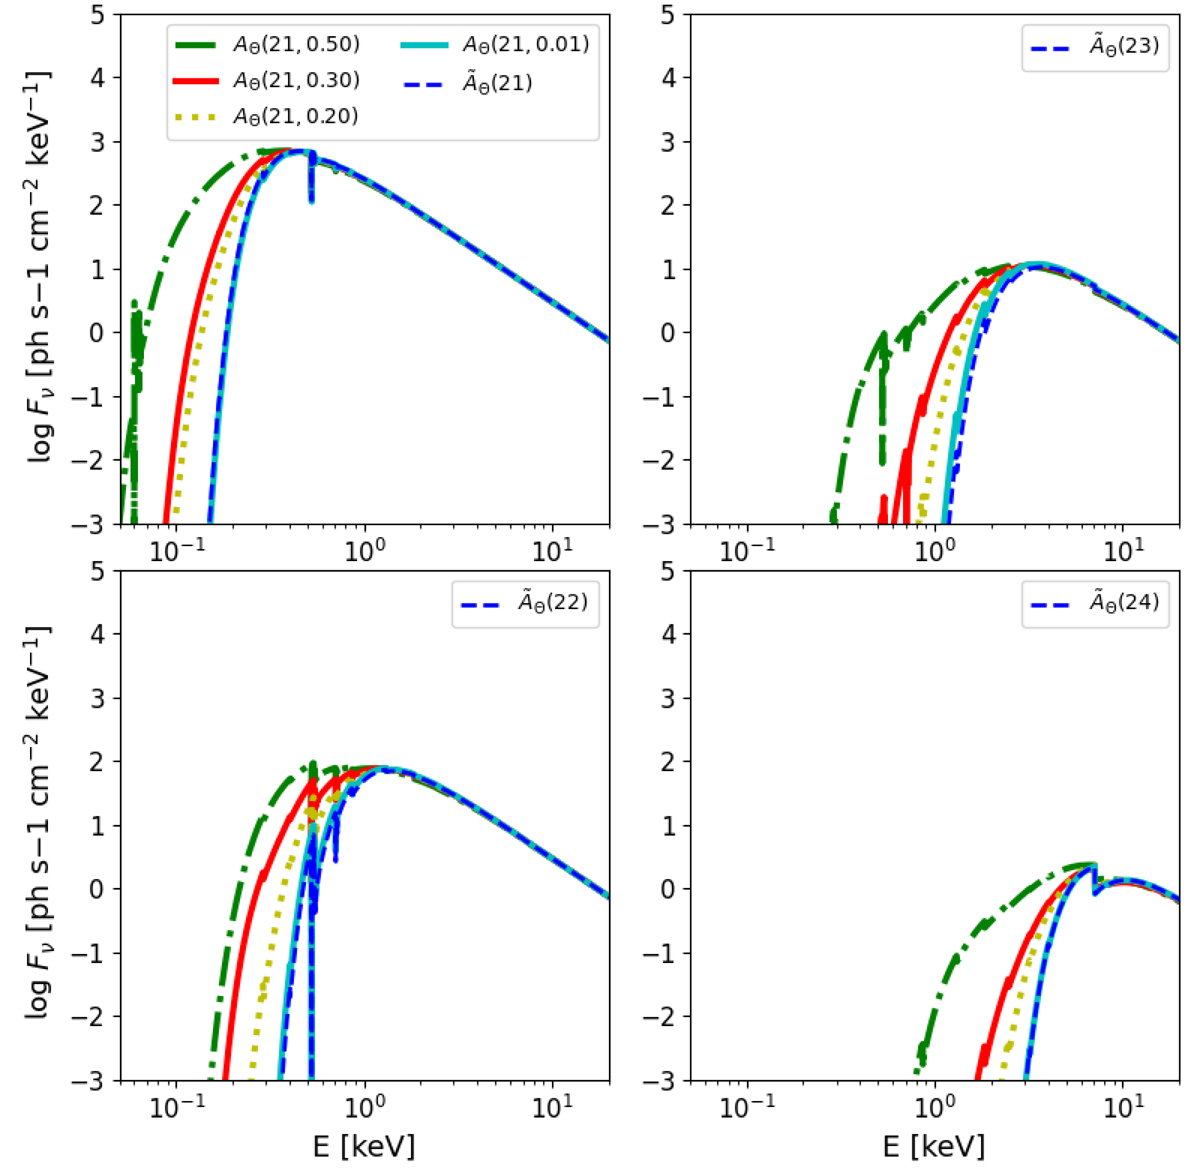
Power-law spectrum Fν ∝ ν−2 absorbed by a distribution of column densities. The distribution Θ is drawn from a lognormal with avgΘ = 21.0 (upper left panel), 22.0 (upper right), 23.0 (lower left), and 24.0 (lower right) dex [cm−2]. Distributions for different stdΘ are also shown in each panel: stdΘ = 0.5 (dot-dashed green line), 0.3 (solid red), 0.2 (dotted yellow), 0.01 (solid cyan). The dashed blue line shows an absorbed flat spectrum ![]() with the same normalization, absorbed by NH = avgΘ in each plot.
with the same normalization, absorbed by NH = avgΘ in each plot.
Current usage metrics show cumulative count of Article Views (full-text article views including HTML views, PDF and ePub downloads, according to the available data) and Abstracts Views on Vision4Press platform.
Data correspond to usage on the plateform after 2015. The current usage metrics is available 48-96 hours after online publication and is updated daily on week days.
Initial download of the metrics may take a while.