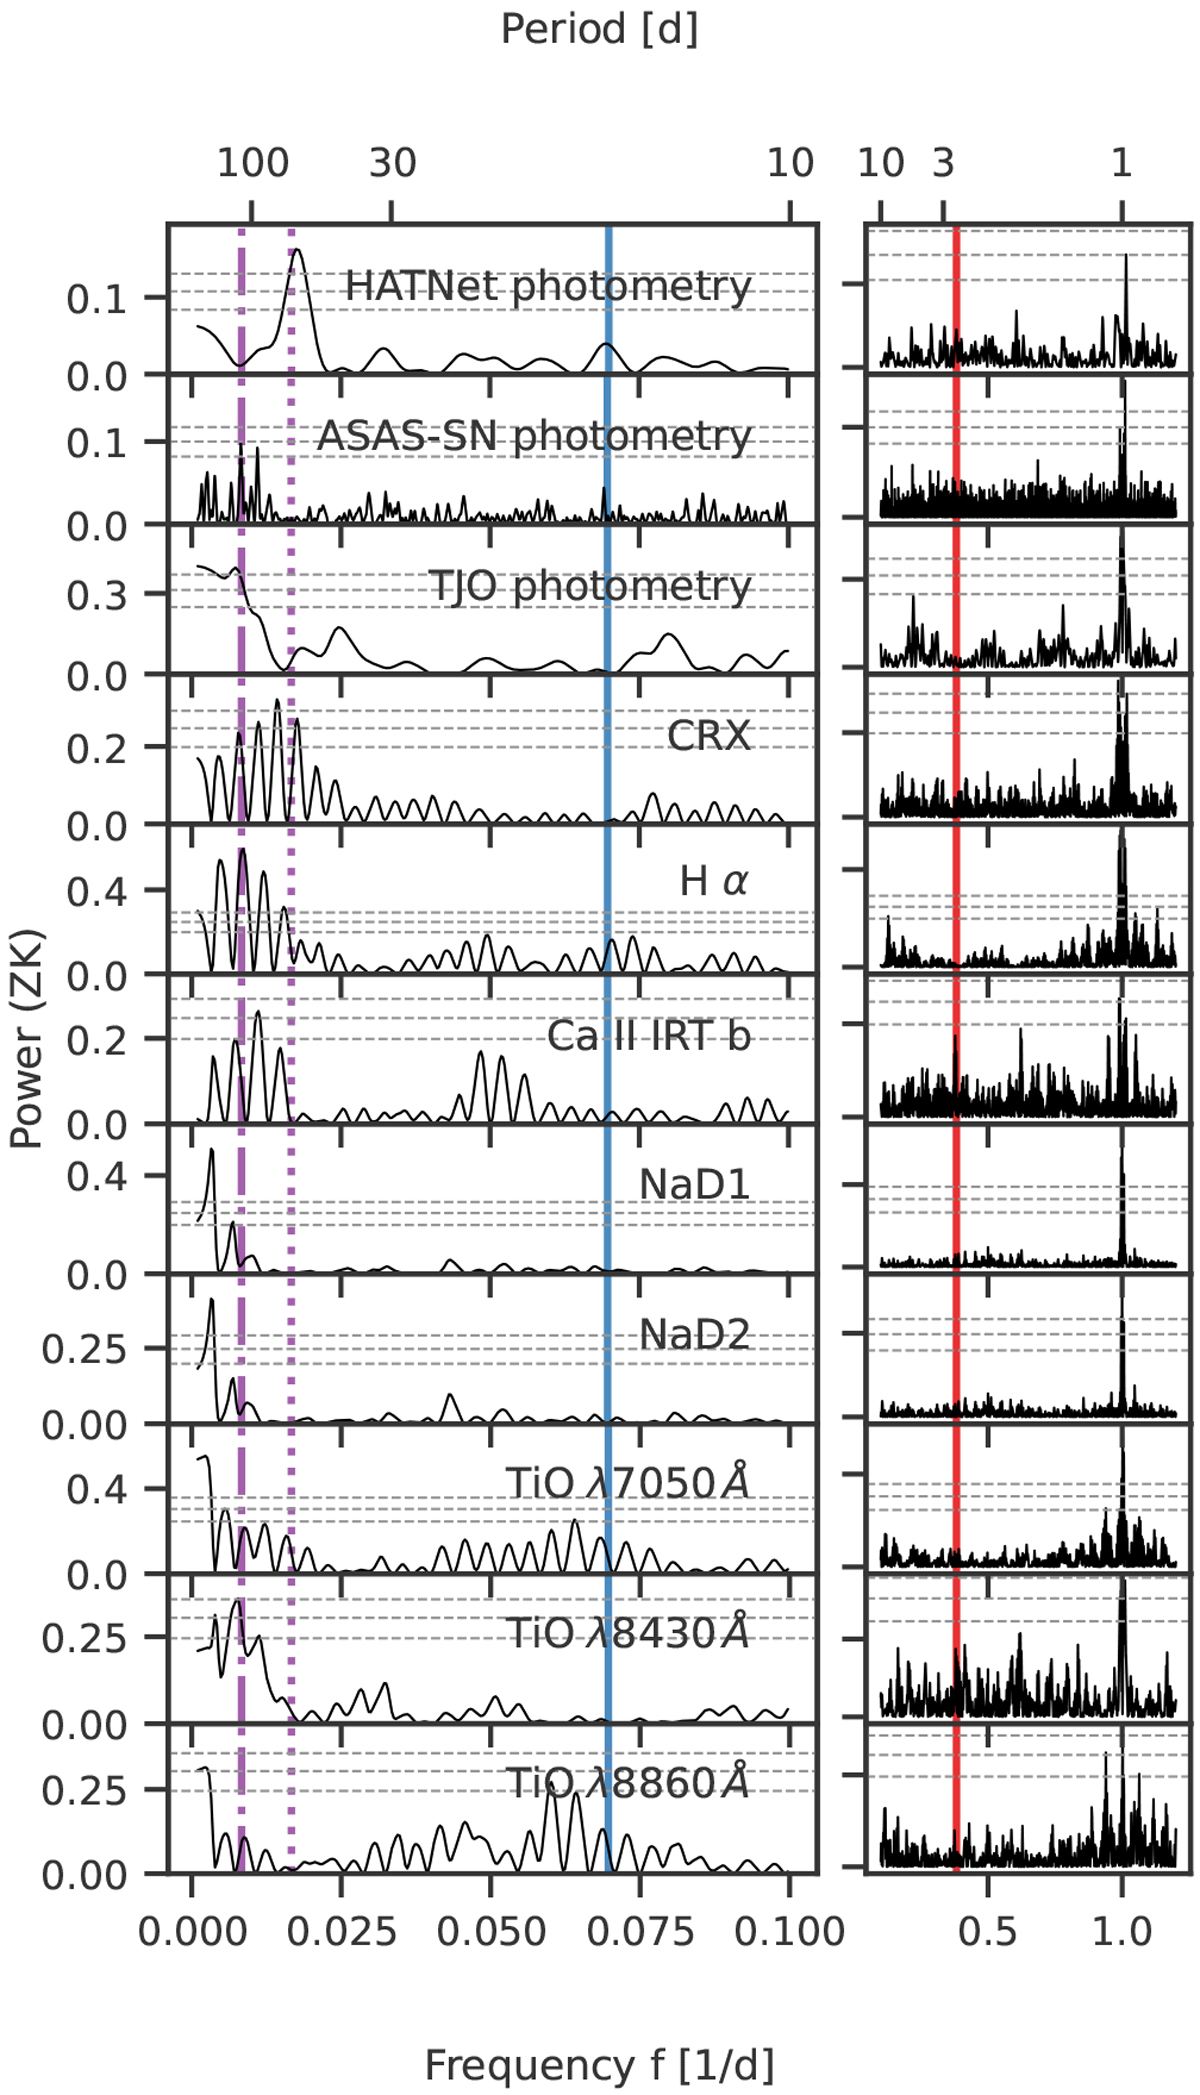
Fig. 8
Download original image
GLS periodograms of photometry and activity indicators. The first three panels show the photometry from HATNet, ASAS-SN, and TJO, and the following panels show the activity indicators derived from CARMENES, which show signals with less than 1% FAP. The stellar rotation of P ≈ 122 d, as determined from the photometry, is indicated by the purple dot-dashed line and its second harmonic (P∕2) by the purple dotted line. As in Fig. 4, the period of the transiting planet is denoted by the red solid line, and the ~15 d periodicity is marked in blue, respectively. We normalised the power using the parameterisation of Zechmeister & Kürster (2009) and the 10, 1, and 0.1% false alarm probabilities denoted by the horizontal grey dashed lines are calculated using the analytic expression.
Current usage metrics show cumulative count of Article Views (full-text article views including HTML views, PDF and ePub downloads, according to the available data) and Abstracts Views on Vision4Press platform.
Data correspond to usage on the plateform after 2015. The current usage metrics is available 48-96 hours after online publication and is updated daily on week days.
Initial download of the metrics may take a while.