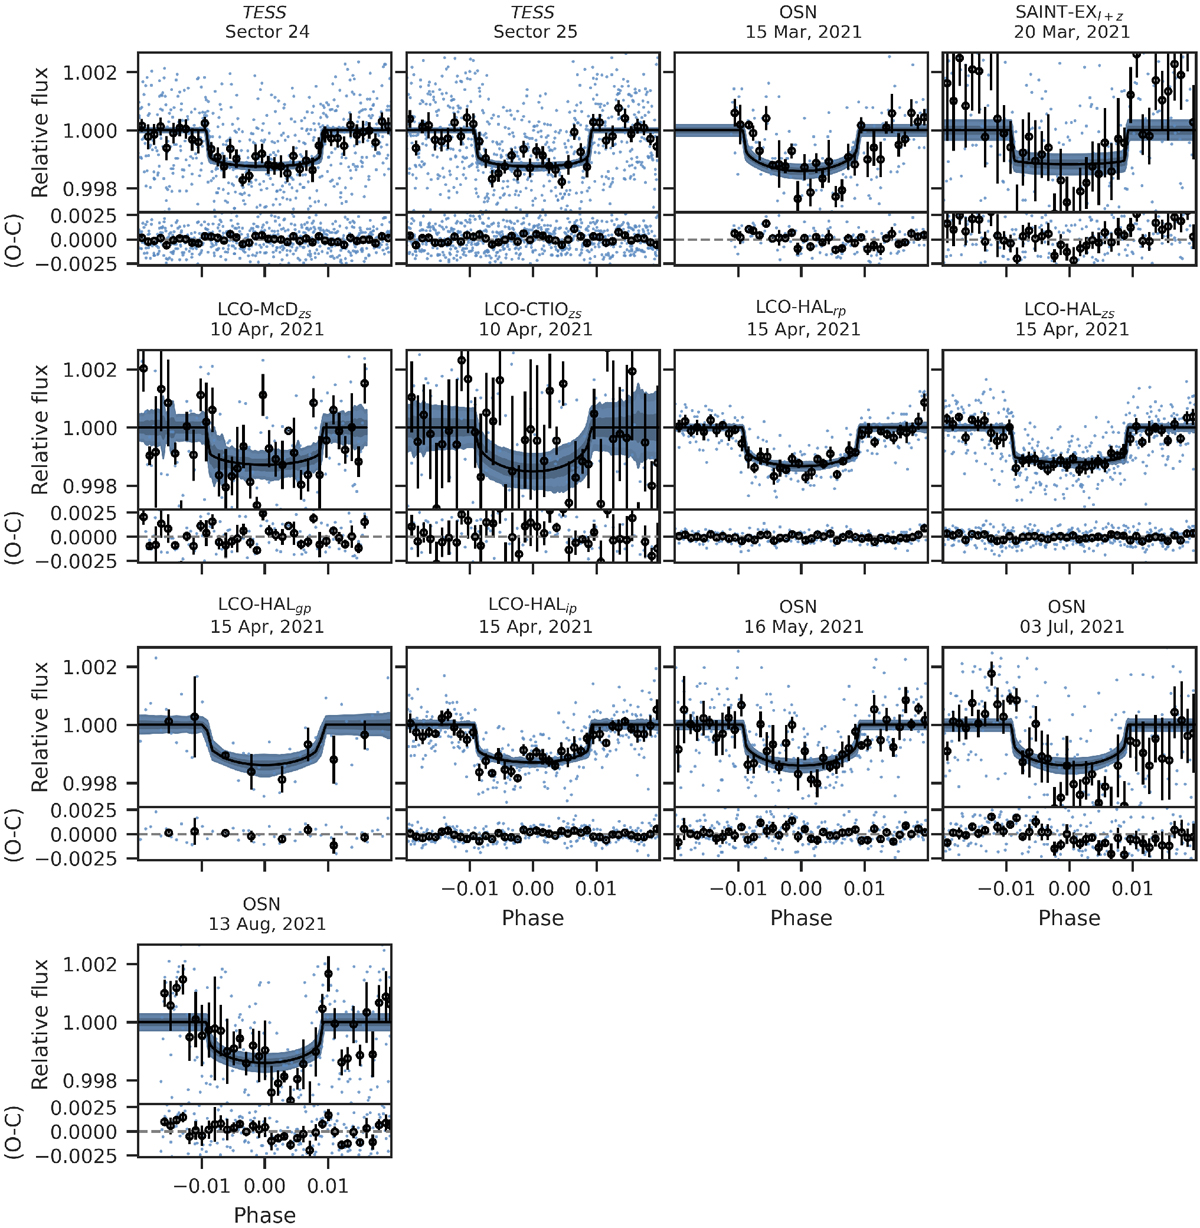
Fig. 7
Download original image
Results from the joint fit for the transit observations. The black lines represent the median of 10 000 samples from the posterior phase-folded to the period of the transiting planet. Credibility intervals of 68%, 95%, and 99% are displayed by the blue shaded areas. The black points show the data binned to 0.001 in phase, and the measurements that were used for the fit are denoted by the blue dots. As for the RVs, the residuals after subtracting the median model are shown in the lower panel of each plot.
Current usage metrics show cumulative count of Article Views (full-text article views including HTML views, PDF and ePub downloads, according to the available data) and Abstracts Views on Vision4Press platform.
Data correspond to usage on the plateform after 2015. The current usage metrics is available 48-96 hours after online publication and is updated daily on week days.
Initial download of the metrics may take a while.