Fig. 6
Download original image
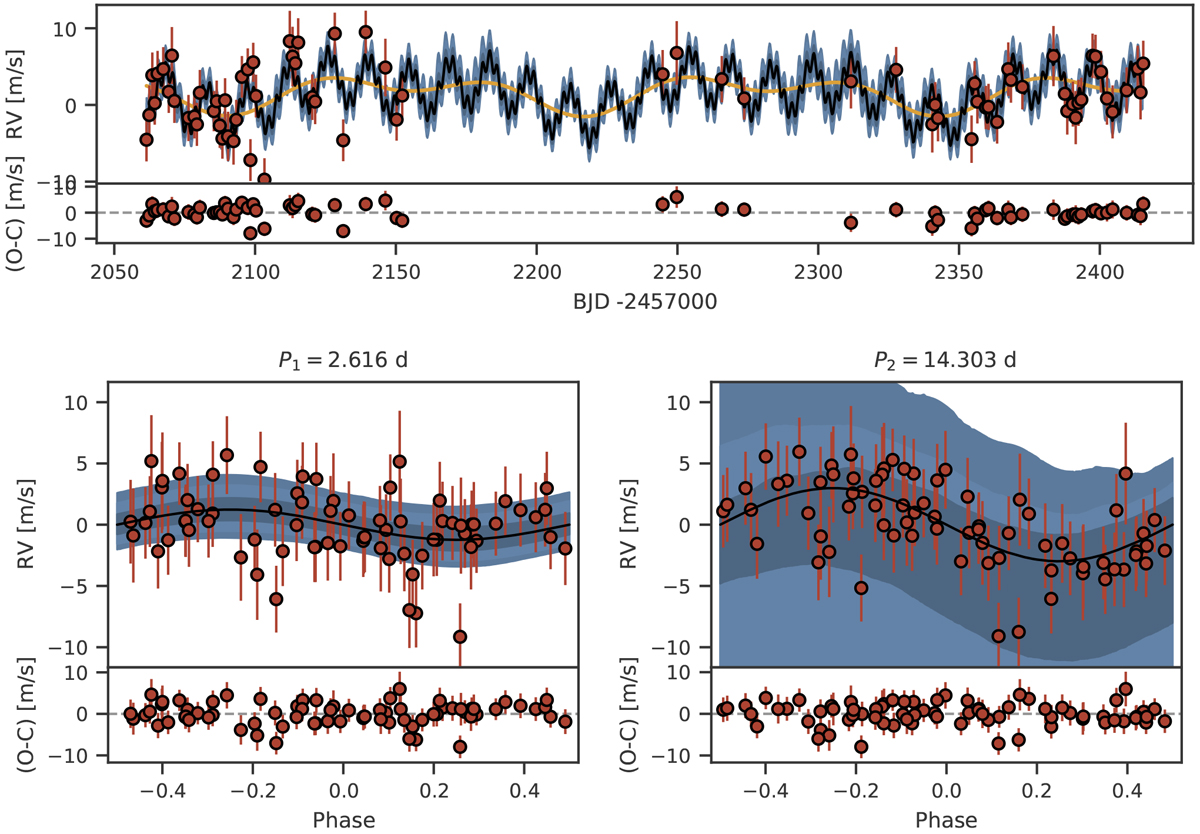
Results for the CARMENES RV from the joint fit with the transits. The black lines show the median of 10 000 samples from the posterior and the blue shaded areas denote the 68%, 95%, and 99% credibility intervals, respectively. The orange line shows the GP model. Error bars of the measurements include the instrumental jitter added in quadrature. The residuals after subtracting the median models are shown in the lower panels of each plot. Top: RVs over time. Bottom: RVs phase-folded to the periods of the transiting planet (left) and the 14.3 d signal (right).
Current usage metrics show cumulative count of Article Views (full-text article views including HTML views, PDF and ePub downloads, according to the available data) and Abstracts Views on Vision4Press platform.
Data correspond to usage on the plateform after 2015. The current usage metrics is available 48-96 hours after online publication and is updated daily on week days.
Initial download of the metrics may take a while.