Fig. 4
Download original image
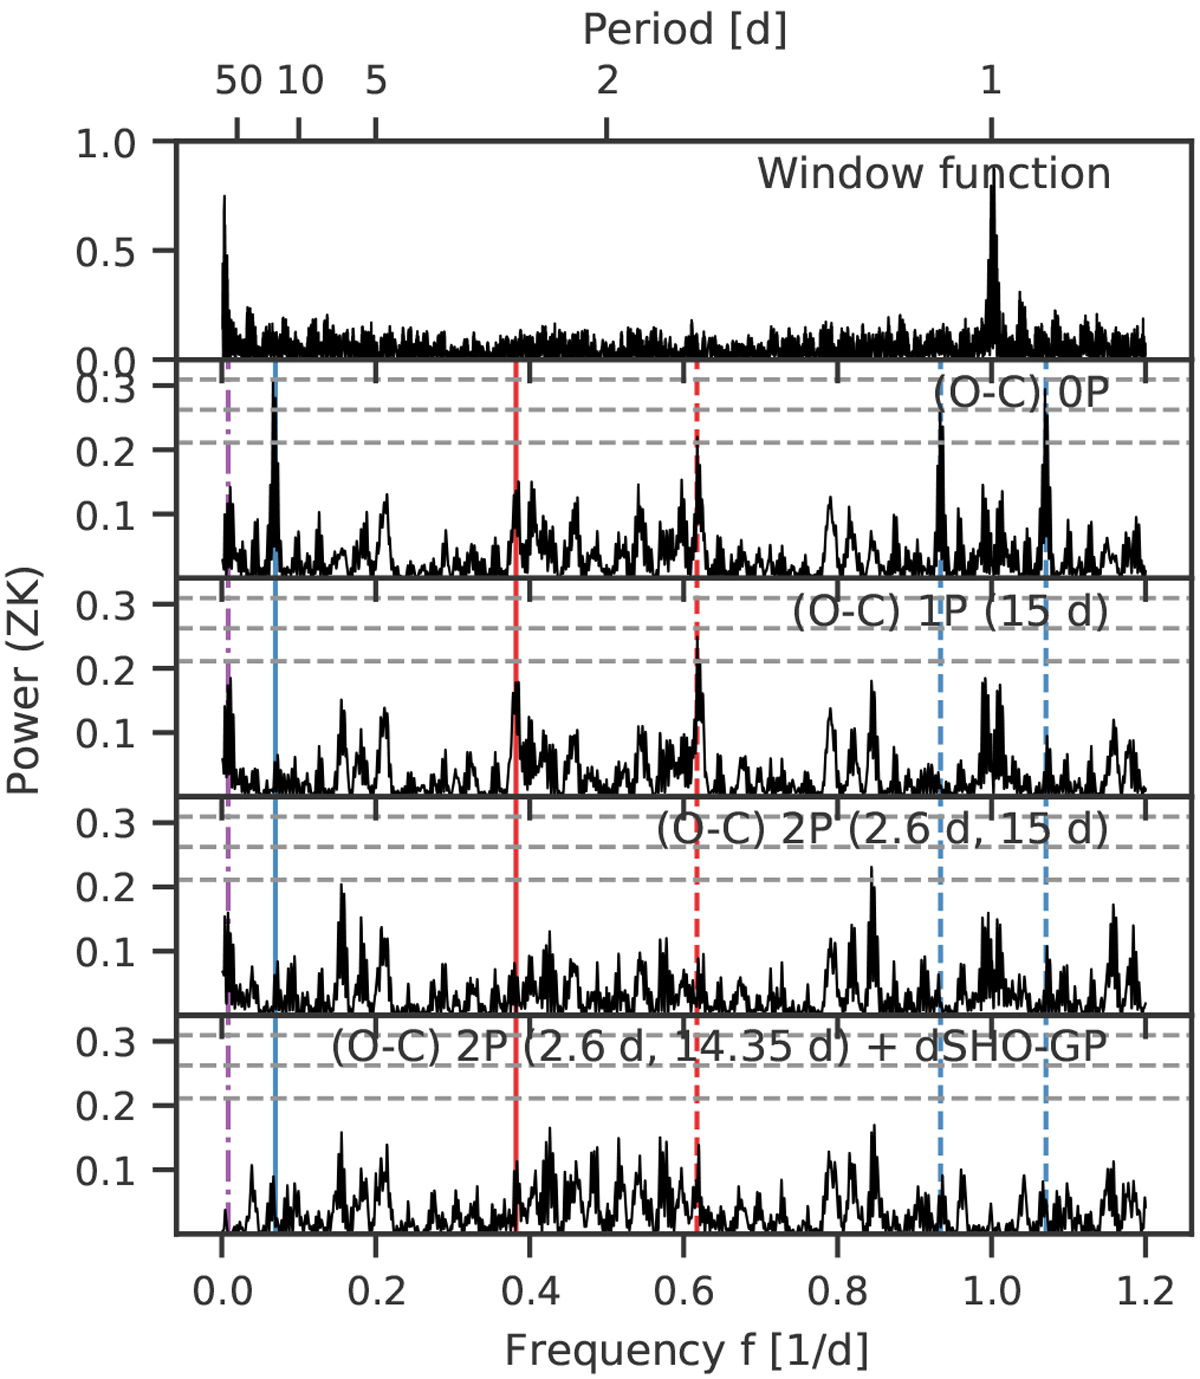
GLS periodogram analysis of the RVs. In the first panel, we show the window function of the CARMENES data. In the subsequent panels, the residuals after subtracting models of increasing complexity are presented. The components that were considered for the fits are listed in the inset texts (see also Table 3). The period, P = 2.62 d, and one-day alias, P = 1.62 d, of the transiting planet are marked by the red solid and dashed lines, while the ~ 15-day periodicity and its daily aliases are marked by blue solid and dashed lines, respectively. Additionally, even though insignificant in the periodogram, the stellar rotation period of P = 122 d (Sect. 4.7) is indicated by the purple dot-dashed line. We normalised the power using the parametrisation of Zechmeister & Kürster (2009), and the 10, 1, and 0.1% FAPs denoted by the horizontal grey dashed lines were calculated using the analytic expression.
Current usage metrics show cumulative count of Article Views (full-text article views including HTML views, PDF and ePub downloads, according to the available data) and Abstracts Views on Vision4Press platform.
Data correspond to usage on the plateform after 2015. The current usage metrics is available 48-96 hours after online publication and is updated daily on week days.
Initial download of the metrics may take a while.