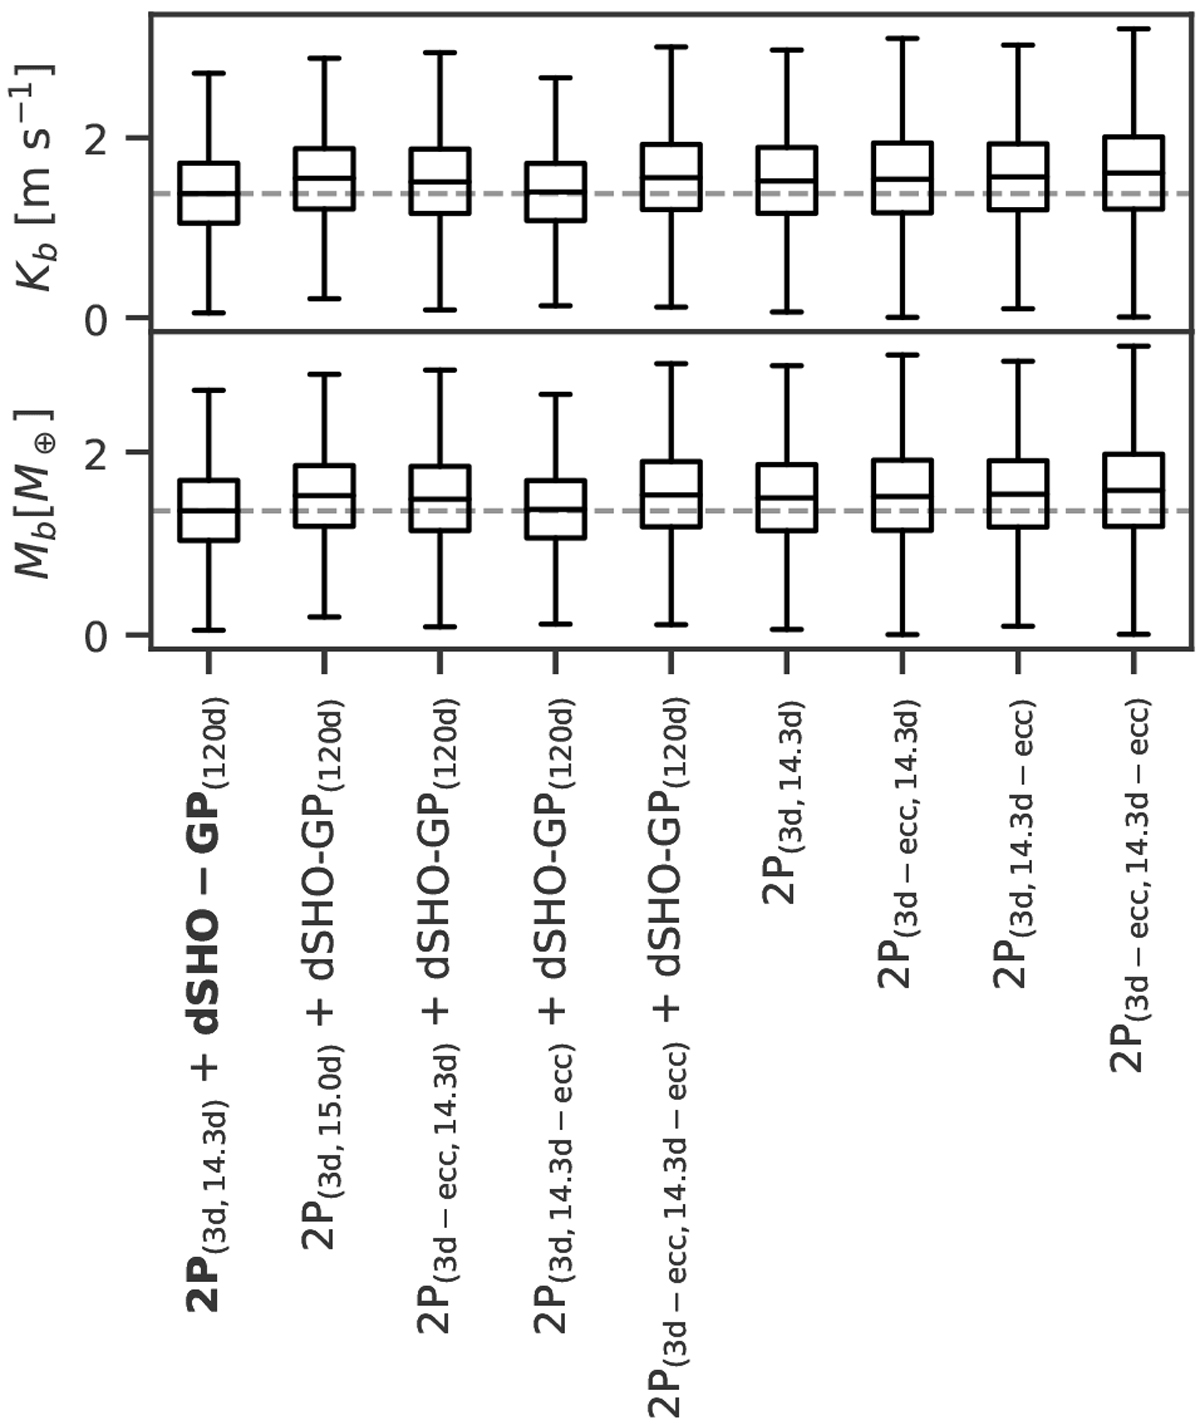
Fig. B.2
Download original image
Comparison of the amplitudes and resulting minimum masses for the different models considered. The box plots show the posterior distribution from the model comparison presented in the RV-only analysis (Sect. 4.5). The width of each box corresponds to the interquartile range (IQR), and the whiskers mark the first quartile minus 1.5× the IQR and the third quartile plus 1.5× the IQR, respectively. To facilitate the comparison, the grey dashed line shows the median posterior value of our selected model.
Current usage metrics show cumulative count of Article Views (full-text article views including HTML views, PDF and ePub downloads, according to the available data) and Abstracts Views on Vision4Press platform.
Data correspond to usage on the plateform after 2015. The current usage metrics is available 48-96 hours after online publication and is updated daily on week days.
Initial download of the metrics may take a while.