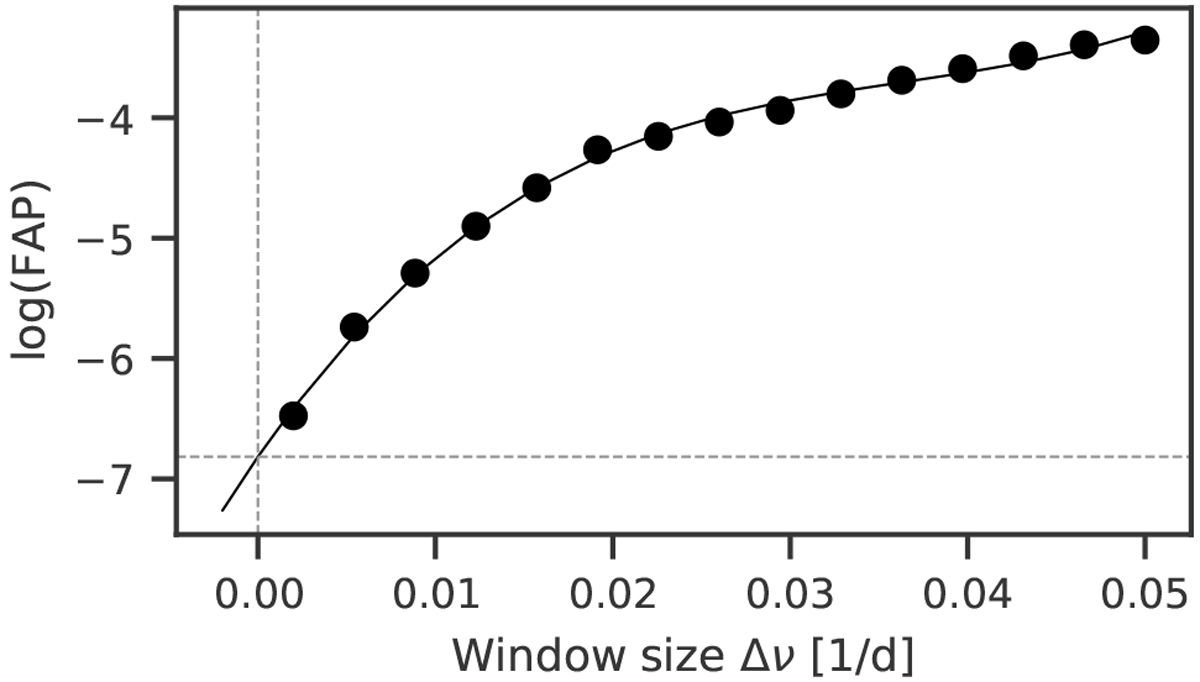
Fig. B.1
Download original image
Determining the FAP for the signal of the transiting planet in the RVs. For each window size, the FAP was calculated comparing the combined power of the highest peaks appearing around the 2.62-day period of the transiting planet candidate and the 1.62-day alias from 50 000 permutations with the combined power of the signals in the original GLS. The black line shows a third-order polynomial fit to the data, which is extrapolated to zero to determine the FAP.
Current usage metrics show cumulative count of Article Views (full-text article views including HTML views, PDF and ePub downloads, according to the available data) and Abstracts Views on Vision4Press platform.
Data correspond to usage on the plateform after 2015. The current usage metrics is available 48-96 hours after online publication and is updated daily on week days.
Initial download of the metrics may take a while.