Free Access
Fig. 1
Download original image
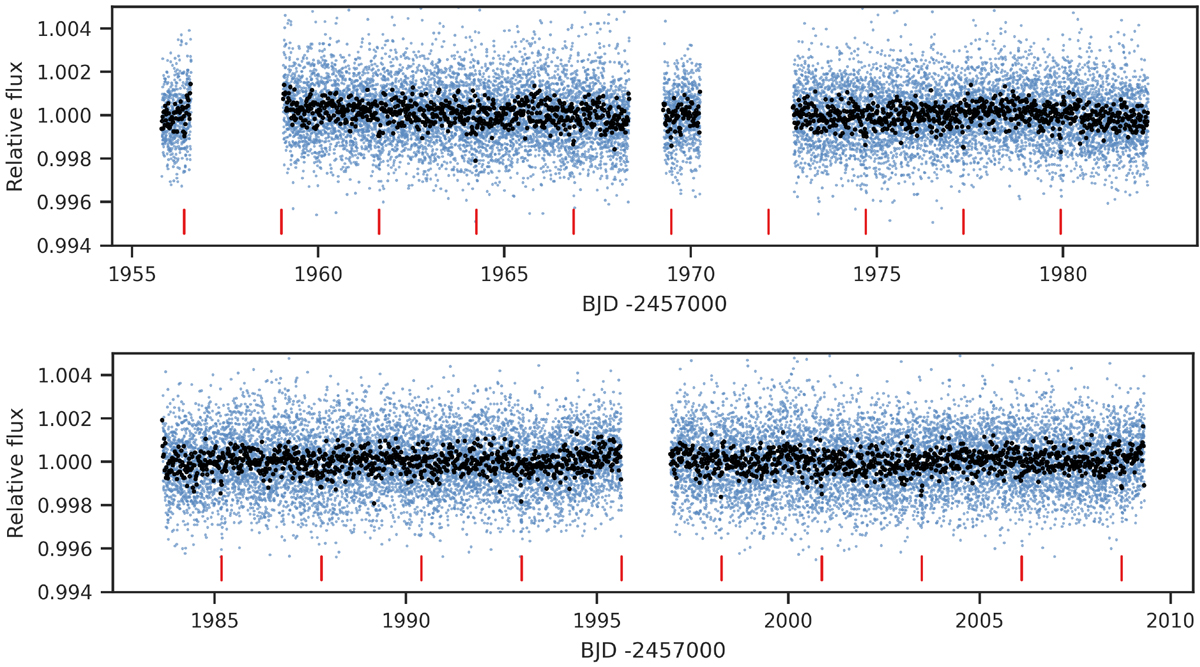
TESS PDCSAP light curves for sector 24 (top) and sector 25 (bottom). The blue points are the measurements and the black dots are 20 min bins. The transit times of GJ 3929 b are indicated by red ticks.
Current usage metrics show cumulative count of Article Views (full-text article views including HTML views, PDF and ePub downloads, according to the available data) and Abstracts Views on Vision4Press platform.
Data correspond to usage on the plateform after 2015. The current usage metrics is available 48-96 hours after online publication and is updated daily on week days.
Initial download of the metrics may take a while.