| Issue |
A&A
Volume 659, March 2022
|
|
|---|---|---|
| Article Number | A78 | |
| Number of page(s) | 18 | |
| Section | Planets and planetary systems | |
| DOI | https://doi.org/10.1051/0004-6361/202142590 | |
| Published online | 09 March 2022 | |
Diverse space weathering effects on asteroid surfaces as inferred via laser irradiation of meteorites
1
State Key Laboratory of Lunar and Planetary Sciences, Macau University of Science and Technology,
Macau,
PR China
2
Center for Lunar and Planetary Sciences, Institute of Geochemistry, Chinese Academy of Sciences,
Guiyang (Guizhou),
PR China
e-mail: This email address is being protected from spambots. You need JavaScript enabled to view it.
3
Department of Geology, Northwest University,
Xi’an (Shaanxi),
PR China
4
Center for Excellence in Comparative Planetology, Chinese Academy of Sciences,
Hefei (Anhui),
PR China
5
Shandong Key Laboratory of Optical Astronomy and Solar-Terrestrial Environment, School of Space Science and Physics, Institute of Space Sciences, Shandong University,
Weihai (Shandong),
PR China
e-mail: This email address is being protected from spambots. You need JavaScript enabled to view it.
6
Institut d’Astrophysique Spatiale, CNRS/Université Paris Saclay,
Paris,
France
7
Department of Geological Sciences, Brown University,
Providence (Rhode Island),
USA
8
Japan Aerospace Exploration Agency (JAXA),
Sagamihara (Kanagawa),
Japan
9
Key Laboratory of Earth and Planetary Physics, Institute of Geology and Geophysics, Chinese Academy of Sciences,
Beijing,
PR China
10
CNSA Macau Center for Space Exploration and Science,
Macau,
PR China
11
Nantong Academy of Intelligent Sensing,
Nantong,
Jiangsu,
PR China
Received:
5
November
2021
Accepted:
30
December
2021
Abstract
Context. Space weathering (SW) is crucial to improve the understanding of the evolution of optical characteristics on airless bodies. The classical view based on research of the Moon suggests that SW decreases albedo (darkening) and steepens spectral slope (reddening) in visible to near-infrared (VIS-NIR) wavelengths, producing nanophase iron (npFe0). However, this conclusion is not perfectly applicable to asteroids.
Aims. In this study, we focus on investigating the space weathering spectral alteration effects (SWSAE) and the causes of spectral alteration on various types of asteroids after long-term continuous micrometeoroid bombardments.
Methods. We used a pulsed laser to irradiate eight meteorites at the same energy, namely, of 28 mJ, in ten shots, including ordinary chondrites (OCs), aubrite (Aub), enstatite chondrites (ECs), CO, CV, and CM carbonaceous chondrites. Then we measured and compared the virgin and irradiated VIS-NIR reflectance spectra of these meteorites. We further surveyed the causes of spectral alteration through a scanning electron microscope and transmission electron microscope.
Results. Three different SWSAE are shown: (1) darkening and reddening on OCs, Aub, CO, and CV chondrites; (2) brightening and reddening on ECs; (3) brightening and bluing on CM chondrite. After irradiation, npFe0 and nanophase iron-nickel particles were respectively found in CV and CO chondrites; thick amorphous layers without any nanophase particles were found in Aub; melting and sputtering of metal were observed in ECs; a great deal of vesicles or bubbles without any nanophase particles were found in CM chondrite.
Conclusions. The long-term SW via micrometeoroid bombardments can spectrally remodel asteroid surfaces in different ways: darken and redden anhydrous silicate asteroids (e.g., S-, E-, and K-types); brighten and redden metal-rich M-type objects. The SWSAE of volatiles-rich carbonaceous asteroids (e.g., Ch-, Cgh-, and D-types) is related to SW degree: darkening and bluing at low degree then brightening and continue bluing as the SW degree increases. The various spectral units on Ryugu, Bennu, and Phobos can be created by the heterogeneity of the degree of SW.
Key words: minor planets, asteroids: general / meteorites, meteors, meteoroids / methods: analytical
© ESO 2022
1 Introduction
Space weathering (SW), as a universal surface alteration process, has been found on many bodies that lack the protection of a thick atmosphere (Pieters & Noble 2016). This process was first proposed on the basis of observations of lunar crater rays merging into the background (darkening) over time (Gold 1955). This scenario was subsequently proven accurate by Apollo 11 samples, whose natural fines showed a lower reflectance than the pulverized crystalline rock from the same site (Hapke et al. 1970; Gold et al. 1970). Hapke et al. (1975) predicted the vapor-deposit origin of nanophase iron (npFe0) and considered npFe0 to be the main SW product modifying the spectra of fresh minerals. Until the 1990s, the vapor-deposit phenomenon and npFe0 were distinctly found in lunar samples (Keller & McKay 1993, 1997). Based on the comprehensive support of lunar remote sensing observations (Adams & McCord 1970), the analysis of samples (Keller et al. 1997, 1998), simulated experiments (Hapke et al. 1970; Hapke 1973; Allen et al. 1996; Sasaki et al. 2001; Noble et al. 2007), and establishment of theoretical models (Hapke 1981, 1993, 2001), classical space weathering spectral alteration effects (SWSAE) and their causes have been widely accepted. This is exemplified by the lunar model, demonstrating that SW produces npFe0, which plays a key role in moderating absorption bands, reducing reflectance (darkening), and steepening near-infrared slopes (reddening).
The success of SW research on the Moon (Keller & McKay 1993, 1997; Keller & Clemett 2001; Noble et al. 2007; Hapke 1981, 1993, 2001; Lucey et al. 2000, 2017; Trang & Lucey 2019; Gou et al. 2020) has naturally lead to the application of “lunar model” to asteroids. For instance, orbital investigations for the S-type asteroid (433) Eros by the Near-Earth Asteroid Rendezvous (NEAR)-Shoemaker spacecraft revealed the darkening and reddening SWSAE (Clark et al. 2001). In particular, spectroscopic observations of the S-type asteroid (25143) Itokawa by the Hayabusa mission (Abe et al. 2006; Hiroi et al. 2006), when combined with detailed analysis of returned samples (Noguchi et al. 2011; Matsumoto et al. 2015), further verified the “lunar model”. In the decade following the Hayabusa mission, the “lunar model” became the standard explanation for SW effects on other types of asteroids.
However, increasing evidence seems to indicate that the “lunar model” is not sufficient to achieve an ideal interpretation of the diverse and complicated spectra of asteroids, starting with primitive carbonaceous bodies. In particular, the spectroscopic observationsof the Cb-type asteroid (162173) Ryugu (Sugita et al. 2019; Kitazato et al. 2019; Morota et al. 2020; Tatsumi et al. 2020, 2021) by the Hayabusa2 sample return mission (Tsuda et al. 2013) showed spectral variations in albedo and slope. Thesevariations have been explained through (1) collisional-mixing of anhydrous silicate-rich asteroids with disrupted-reaccumulated primitive carbonaceous bodies (Sugita et al. 2019; Morota et al. 2020; Tatsumi et al. 2021) or (2) original primitive bluer boulders strongly turning redder due to pulverization by small impacts and metamorphism by solar heating near the Sun early or via a SW process (Morota et al. 2020). An artificial impact experiment on Ryugu has suggested that the subsurface material is darker than the material on the weathered surface (reflectance at 0.55 μm decreases about 20%) (Arakawa et al. 2020), which is contrary to what happens on the Moon. In fact, for CM and CI carbonaceous chondrites that are the daughters of primitive carbonaceous bodies (Beck et al. 2010; Vernazza et al. 2016), SW simulation experiments have showed diverse results, such as “darkening and bluing” (Hiroi et al. 2013; Matsuoka et al. 2015, 2020; Thompson et al. 2019, 2020) and “brightening and bluing” SWSAE (Zhang et al. 2020; Lantz et al. 2017), instead of simple “darkening and reddening” as in the “lunar model”. Due to the lack of in-depth understanding of SW processes on asteroids, there is still no consensus on the role SW plays in variations on color and slope for the B-type asteroid (101955) Bennu (Lauretta et al. 2019; Walsh et al. 2019; Hamilton et al. 2019; DellaGiustina et al. 2020; Simon et al. 2020), the target of the NASA OSIRIS-REx (Origins, Spectral Interpretation, Resource Identification, and Security-Regolith Explorer) mission (Lauretta et al. 2017).
Moreover, for E-type asteroids, the iron-poor or iron-free asteroids formed in a reduced environment closest to the Sun (Fornasier et al. 2008; Gradie & Tedesco 1982), utilization of “lunar model” is obviously not suitable due to the lack of adequate iron as the source of npFe0. We still know very little about SWSAE on M-type asteroids targeted by the Psyche mission (Reddy et al. 2019), D-type and P-type Trojan asteroids targeted by the Lucy mission (Levison et al. 2016), and Phobos, the Martian moon to be investigated by the sample return MMX (Martian Moons eXploration) mission (Campagnola et al. 2018). In addition, we do not have adequate knowledge of the similarities and differences of spectral alteration effects among SW products, such as nanophase troilite (npFeS), nanophase iron-nickel (npFeNi), npFe0, and recrystallized carbon (Britt & Pieters 1990, 1994; Clark et al. 1992; Keller et al. 2013; Okazaki et al. 2015). Therefore, despite the fact that studies of SW have been ongoing for over half a century, considering the diversity of asteroid composition and the complexity of space environment in the Solar System (Gradie & Tedesco 1982; DeMeo & Carry 2014), the “lunar model” of SW that we have upheld may be just the tip of the iceberg among many species. This has drawn us to develop a deeper understanding of SW on asteroids.
In this paper, we focus on investigating the SWSAE and the causes of spectral alteration on various types of asteroids. Laser irradiation of different types of meteorites can simulate the SW process driven by micrometeoroid bombardments on different types of asteroid surfaces (Sasaki et al. 2001). Spectral observations of meteorites before and after irradiation allows us to know the SWSAE on asteroids. Microscopic observations of meteorites before and after irradiation provide an opportunity to understand the causes of spectral alteration. This study is aimed at helping us to understand the “diversity” of SW on asteroids and to understand how SW remodels asteroid surfaces.
2 Methods
2.1 Sample selection and processing
In this study, we selected eight meteorites to measure reflectance spectra and to irradiate, including two ordinary chondrites (OCs): Xingyang (H6) and Kheneg Ljouâd (LL5/6), one aubrite (Aub): Norton County, two enstatite chondrites (ECs): Abee (EH4) and Indarch (EH4), and three carbonaceous chondrites (CCs): Allende (CV3), Shanshan 002 (CO3), and Murchison (CM2). This broad sample ensures the diversity of asteroid types simulated here. We provide detailed information on the sample composition in Appendix A.
To avoid contamination, all the samples were kept in a dry environment at room temperature (~25°C) prior to irradiation. Our Xingyang, Kheneg Ljouâd, and Norton County are fresh fragments, and the other meteorites are slabs. The locations for spectral measurements of Xingyang, Kheneg Ljouâd, and Norton County were selected in their natural and fresh fracture surfaces (no grindingor polishing). For Abee, Indarch, Allende, Shanshan 002, and Murchison, their surfaces were firstly ground by corundum (Al2O3) abrasives toexpose fresh area inside, then polished by diamond polish agent with size ~5 μm as the positions to measure virgin spectra and to irradiate. Although the surface processing methods for “Xingyang, Kheneg Ljouâd, and Norton County” and “Abee, Indarch, Allende, Shanshan 002, and Murchison” were different (the surfaces of the former are rougher, while the surfaces of latter are smoother), the results of SWSAE are not significantly affected because we only focused on the spectral changes before and after irradiation in the same sample.
2.2 Laser irradiation experiment
We used the 532 nm wavelength Nd-YAG pulsed laser equipment located in the Institute of Geochemistry at the Chinese Academy of Sciences to irradiate these meteorites in a vacuum environment at 5 × 10⁻⁶ mbar. The pulse width was 6 ns. For each sample, the energy was set to 28 mJ per pulse, and we irradiated each spot for ten shots. The laser beam spot diameter was 1 mm, hence, the energy density on the surface was ~35.67 J cm−2. This is equivalent to long-term(~109 yr) continuous micrometeoroid bombardments on near-Earth asteroids (for the SW age estimation, see Appendix B). For each sample, the irradiated area was selected to represent the overall composition as closely as possible.
Spectral parameters of 8 meteorites used in this study before and after irradiation.
2.3 Spectral measurements and analysis
For each sample measurement, we collected the spectral signals of at least three locations with composition as homogeneous as possible. Weabandoned the spectral curves with the highest and the lowest reflectance, then selected one of the residual similar spectral curves as the representative spectrum, ensuring that each spectrum reflects the overall composition of each sample as much as possible.
All “virgin” unirradiated and irradiated spectral data were gathered by the ASD FieldSpec4 spectrometer installed in the Reflectance Spectroscopy Laboratory of Shandong University in Weihai, Shandong Province, China. This spectrometer is equipped with a silicon array detector and two InGaAs detectors to collect visible to near-infrared (VIS-NIR) reflectance spectral signals from 0.35 to 2.5 μm wavelengths. The light source is an ASD illuminator with a 57 W quartz-tungsten-halogen lamp, which can provide stable illumination over a 0.35–2.5 μm range for spectral measurement. Before measuring the spectra of our samples, we used a Spectralon Diffuse Reflectance Standard white plate for calibration and then set up the relative positions of the light source, white plate, and optical fiber probe as follows. We (1) adjusted the position of the light source so that light source was 30 cm away from the surface of standards, forming a uniform illumination spot with a diameter of approximately 6.3 cm; (2) adjusted the position of detection fiber so that it was 5 mm from the surface of the white plate to ensure that all of the collected signals come from a circular area with a diameter of ~3 mm; (3) measured the spectrum of each sample in turn.
For each sample spot, the spectral signal was repeatedly collected 300 times and the average value was taken. The dark current was collected 100 times and averaged at each sample spot, then it was subtracted from the measurement. All the spectral measurements were performed with a phase angle of 30° (incident angle is 0°, and emission angle is 30°) in the atmosphere, and the thermal radiation from the light source caused the surface temperature of samples to reach ~40°C. Each sample measurement took about 1 min.
Then we analyzed the changes of spectral parameters before and after irradiation, including the absolute reflectance, near-infrared slope, absorption center, and band depth. Table 1 lists these spectral parameters before and after irradiation. For further details of the calculation of these spectral parameters, we refer to Appendix C.
2.4 Microscopic observations
The FEI Scios Dual Beam scanning electron microscope (SEM) located in the Institute of Geochemistry, Chinese Academy of Sciences, Guiyang, China, was used to investigate the micro characteristics after irradiation. We used it to obtain the secondary electron images and backscattered electron images. Adopting this equipment for Norton County, Allende, Shanshan 002, and Murchison, we also made focused ion beam (FIB) sections for a transmission electron microscope (TEM) analysis (the detailed FIB section-making process is described in Wu et al. 2017). The FEI Talos F200X field emission TEM located in the Suzhou Institute of Nano-Tech and Nano-Bionics, Chinese Academy of Sciences, Suzhou, China, was used to further observe the microstructure after irradiation, which has the capability to obtain high-resolution images for the FIB sections. The TEM is also equipped with an energy dispersive spectrometer (EDS) to characterize the element distribution information.
3 Results
3.1 Spectral observations
Compared with the virgin samples, after irradiation, both OCs Xingyang and Kheneg Ljouâd show shallower 1 μm and 2 μm absorption, along with lower reflectance and a steeper spectral slope in VIS-NIR region (Figs. 1a and f). For Xingyang, the absolute reflectance at 0.55 μm (R0.55) decreases from 0.1692 to 0.1; band depths (BD) at 1 μm and 2 μm decrease 8.33% (from 29.72% to 21.39%) and 4.81% (from 16.02% to 11.21%), respectively; and the ratio of reflectance at 2.45 μm to that at 0.75 μm (R2.45/R0.75) increases from the negative value (0.937) to the positive value (1.283). For Kheneg Ljouâd, R0.55 decreases from 0.174 to 0.1135, BD at 1 μm and 2 μm decrease 11.2% (from 30.98% to 19.78%) and 0.32% (from 3.99% to 3.67%), respectively; and R2.45/R0.75 increases from 0.836 to 1.082 (Table 1).
For Aub Norton County, due to the irradiation, reflectance significantly decreases (R0.55 decreases from 0.5193 to 0.2514) while R2.45/R0.75 increases from 0.866 to 0.984; meanwhile, original weak absorption at 0.89 μm becomes shallower (BD decreases from 1.8% to 1.4%) (Figs. 1b, g, and Table 1).
Compared with the virgin samples, both irradiated CV3 Allende and irradiated CO3 Shanshan 002 show shallower 1 μm and 2 μm absorption and higher VIS-NIR spectral slope, as well as lower reflectance at shorter wavelength region but higher reflectance at longer wavelength region (Figs. 1c and h). For Allende, after irradiation, R0.55 decreases from 0.0832 to 0.0707, R2.45/R0.75 increases from 0.911 to 1.240, BD near 1 μm decreases from 5.66% to 1.71%, and BD near 2 μm decreases from 5.66% to 2.78%. For Shanshan 002, after irradiation, R0.55 decreases from 0.072 to 0.061, R2.45/R0.75 increases from 0.911 to 1.032, and the absorption near 1 μm and 2 μm almost disappears (shown in Table 1).
Two EH4 chondrites Abee and Indarch are featureless in virgin spectra, and after irradiation, their reflectance and spectral slope in VIS-NIR region all increase (Figs. 1d and i). For Abee, R0.55 increases from 0.0729 to 0.0809, R2.45/R0.75 increases from 1.221 to 1.564. For Indarch, R0.55 increases from 0.0614 to 0.0702, R2.45/R0.75 increases from 1.216 to 1.304 (Table 1).
Compared with the virgin sample, CM Murchison shows higher VIS reflectance within 0.35–0.72 μm but lower NIR reflectance within 0.72 to 2.5 μm, and bluer NIR slope (Figs. 1e and j). Meanwhile, with the absence of the absorption band at 0.677 μm, an asymmetric new absorption band at 0.965 μm and a wide absorption between 1 and 1.47 μm were produced. The spectral curve of Murchison also changes from convex (in the virgin spectrum) to linear (in the irradiated spectrum).
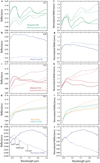 |
Fig. 1 Reflectance spectra without (a–e) and with (f–j) normalization at 0.55 μm of virgin and irradiated meteorites. All solid lines are virgin spectra and dashed lines are irradiated spectra. |
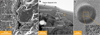 |
Fig. 2 Micro-characteristics of laser irradiated CV3 Allende: (a) SEM secondary electron image of irradiated (left of dotted line) and unirradiated area (right of dotted line); (b) TEM bright field image of FIB section sampled from the box position in (a); (c) TEM high resolution image of npFe0 marked by the box in (b). The interplanar spacing is d = 0.203 nm, consistent with spacing of a crystal lattice plane (110) of α-Fe. |
3.2 Microscopic observations
For CV3 Allende, we selected an area containing both unirradiated and irradiated areas for comparison (Fig. 2a), wherein the irradiated area shows a rougher surface and widespread melting, with lots of individual sputtered coarse grains. The FIB section (Figs. 2b and c) from irradiated area reveals that two sizes of npFe0 particles are distributed across the vapor-deposit rim, amorphous layer (thickness is ~200 nm), and transition layer between amorphous layer and host mineral olivine. The larger size npFe0 particles (~10 to 30 nm) caused by in-situ reduction are distributed at the bottom of the amorphous layer and inside of transition layer, while the smaller size npFe0 particles (~5 to 15 nm) caused by evaporation and deposition are distributed at the top of amorphous layer and inside of the vapor-deposit rim.
In CO3 Shanshan 002 FIB section from the irradiated area, none of npFe0 but npFeNi particles and vesicles were found (Fig. 3a). The npFeNi particles can be divided into two sizes, the smaller size ones (~5 to 10 nm) resided in the amorphous layer, and the larger size ones (~10 to 50 nm) distributed across the transition zone between the amorphous layer and host mineral olivine (Figs. 3b–f). In Fig. 3e, sulfur is gathered in the vapor-deposit rim, indicating the release of sulfur from meteorite during irradiation. A large number of vesicles or bubbles can be seen in the transition layer between the amorphous layer and host minerals (Fig. 3h), where the smaller-sized ones tend to distribute in the lowerpart of the transition layer closer to the matrix, while the larger sized vesicles distribute in the upper part of the transition layer, indicating that volatiles – which may be mainly made up of water (H2O) produced via the dehydration of phyllosilicates (Chen-Lin et al. 1976) – were released during the irradiation process.
The Aubrite Norton County shows universal melting characteristics after irradiation (Figs. 4a and b). Unlike OCs and CV/COchondrites, irradiated Norton County shows the thick amorphous layer (thickness is ~350 nm) on the surface of enstatite, without the appearance of metal particles (Fig. 4c). Considering the insufficient amount of iron as the source of npFe0 in enstatite (En98.7Fs0.10Wo1.12) and forsterite (Fo99.9) (occupying 84.5 vol% and 10 vol% in this meteorite respectively; Watters & Prinz 1979), this result is understandable.
We also obtained an image of EH4 Abee containing unirradiated (top right part in Fig. 5a) and irradiated areas (left part in Fig. 5a), where the irradiated area shows rougher surfaces than unirradiated area. Compared with the smooth surfaces of enstatites in the unirradiated area (top-right region in Fig. 5a), the enstatite fragments in the irradiated area (Fig. 5b) are like the piled soil. Meanwhile, compared with the smooth surfaces of metals in the unirradiated area (top right part in Fig. 5a), the molten metals in the irradiated area (left part in Fig. 5a) are like spread pancake, indicating the original metals are melted during the laser irradiation process. The phenomenon involving the melting of metals can also be seen in Indarch (Fig. 5c), here the molten metal in the irradiated area is like spread pancake. Besides the melting of metals, we also noticed that some metal droplets on the surfaces are distributed around the subsurface metals (Fig. 5d), indicating that the subsurface metals can be excavated by laser irradiation and then sputtered to the surface.
For Murchison, we also took an image containing unirradiated and irradiated areas, wherein the irradiated area (see left part in Fig. 6a) is rougher than the unirradiated area (see right part in Fig. 6a). A molten crater and abundant fragments (size generally is microns) were seen in the irradiated area (see Fig. 6b). At the edge of the irradiated area, a large number of burst bubbles were seen, where the size of bubbles in the edge area (the part sandwiched by two white dotted lines in Fig. 6c) is larger than the irradiated area far away from the edge (the part below the white dotted line labeled “crack” in Fig. 6c), indicating that volatiles (likely to be mainly water produced by dehydration of phyllosilicates) were released from meteorite inside, then migrated to surface, and finally escaped. The releases and migration of volatiles (likely to be mainly composed of water) can be seen more clearly in Fig. 6f, similar to Shanshan 002 in Fig. 3h, the smaller-sized bubbles in Murchison are distributed in the lower part of the surface layer while the larger sized ones are located in the upper part. However, in contrast to Shanshan 002 in Fig. 3h, Murchison shows denser vesicles or bubbles in Fig. 6f, meaning more volatiles (likely to be mainly composed of water) were released than Shanshan 002 during irradiation. Unlike other studies of Murchison (Thompson et al. 2019, 2020), we did not find any nanoparticles in our sample after irradiation.
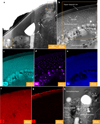 |
Fig. 3 Micro-characteristics of laser irradiated CO3 Shanshan 002: (a) TEM bright field image of the FIB section sampled from irradiated area; (b) TEM HAADF (high-angle annular dark-field) image of the box region in (a); (c–g) TEM EDS mapping in different elements of the box region in (b); (h) a zoomed-in view of the region marked in (a). |
 |
Fig. 4 Micro-characteristics of laser irradiated aubrite Norton County: (a) SEM secondary electron image of laser irradiated area. An irradiated crater with about 1 mm diameter can be recognized; (b) the zoomed-in secondary electron image of the box region in (a). The molten surface is rough and porous; (c) TEM bright field image of FIB section sampled from the box position in (b). |
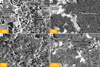 |
Fig. 5 Micro-characteristics of laser irradiated EH4 Abee (a, b) and Indarch (c, d): (a) SEM secondary electron image of unirradiated (top right) and irradiated (left) area. The un-En means unirradiated enstatite; (b) SEM backscattered electron image of irradiated area; (c) SEM secondary electron image of irradiated area; (d) SEM backscattered electron image of irradiated area. |
4 Discussion
4.1 Diversity of irradiated products in meteorites
The species of SW products are closely related to their original materials (Pieters & Noble 2016). For carbonaceous chondrites, CV3 Allende consists of 57 vol% matrix and 43 vol% inclusions (include chondrules) mainly composed of olivine and pyroxene (Fendrich & Ebel 2021). The significant content of olivine (Fa0.3−49, see Simon & Haggerty 1979) and pyroxene in Allende provides the source of elements required for the formation of npFe0. Meanwhile, the low content of volatiles (here mainly referring to water, 0.08–0.45 wt%; see Table A.1) may not be enough to form an oxidizing environment to hinder the reduction of npFe0, just like the production of npFe0 during laser irradiation of olivine and pyroxene (Sasaki et al. 2001; Weber et al. 2020). Therefore, the creation of npFe0 in Allende is not surprising. Next, CO3 Shanshan 002 is composed of 32 vol% matrix, 48 vol% chondrules (mainly are composed of olivine and pyroxene), 5 vol% refractory inclusions, 5 vol% FeNi metal and sulfide, etc. (see Appendix A). Because olivine (Fa1−73 in chondrules, Fa0−45 in matrix, see Appendix A) and pyroxene only contain rare nickel (0.01–0.06 wt% and 0.02–0.42 wt%, respectively, see Appendix A), in this sample, it seems unlikely that the npFeNi particles in this sample can be directly reduced from silicate minerals. Due to the inherent presence of FeNi metal and sulfide, we hence speculate that these npFeNi particles were produced by laser dispersion of original FeNi metals in the meteorite, or were the residue of sulfur escaping from the rich Fe–Ni–S material (Fig. 3g). In addition, although the higher proportion of chondrules (48%, indicating a greater content of olivine and pyroxene) and the higher proportion of iron in olivine (Fa1−73) in Shanshan 002 than in CV3 Allende (chondrules less than 43%, olivine is Fa0.3−49), the higher content of volatiles (here mainly referring to water, 3.97–6.36 wt%, see Table A.1) in Shanshan 002 provides a relatively more oxidizing environment, hindering the reduction of npFe0. CM Murchison has the highest proportion of matrix (73 vol%, mainly composed of phyllosilicates) and the lowest proportion of chondrules (25 vol%, mainly composed of olivine (Fa0−40) and pyroxene, see Appendix A), as well as a relatively highest content of volatiles (here mainly referring to water, 10.36–10.81 wt%, see Table A.1). The relatively lower content of iron interacts with the highly oxidizing environment, resulting in the lack of npFe0 in Murchison. For a clearer understanding, we present the iron content in the main silicates and water content in meteorites in Table A.1.
Although the role of volatiles (here mainly referring to water) in affecting the species of SW products has not been of widespread concern, the results of CV, CO, and CM chondrites in this study reveal the antipathy between npFe0 and volatiles (here mainly referring to water). It indicates that volatiles (here mainly referring to water) can play a key role in the production of npFe0 in CCs, wherein “dry” (water-poor) CCs produce npFe0 without obvious vesicles/bubbles structure, while “wet” (water-rich) CCs produce vesicle or bubble structures without npFe0. In addition, the existence of Fe-bearing materials is necessary for the creation of npFe0. Otherwise, even with an environment of reduction, it is difficult to produce npFe0, as proved in the case of irradiated aubrite Norton County.
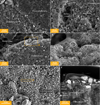 |
Fig. 6 Micro-characteristics of laser irradiated CM2 Murchison: (a) SEM secondary electron image of unirradiated (top right) and irradiated (bottom left) area; (b) SEM secondary electron image of molten crater and fragments produced by laser in the irradiated area; (c) SEM secondary electron image of the irradiated area; (d) the zoomed-in SEM secondary electron image of the box region in (b); (e) the zoomed-in SEM secondary electron image of the irradiated area; (f) TEM bright field image of FIB section sampled from the box position in (e). No nanophase particle but abundant bubbles are seen, and the bubbles tend to increase in size from subsurface to surface, indicating that a lot of volatiles (likely to be mainly water produced by dehydration of phyllosilicates) were released during the irradiated process. |
4.2 Diversity in SWSAE and causes
4.2.1 Darkening and reddening and the role of npFe0, npFeNi particles, and the amorphous layer
Other laser irradiation experiments for ordinary chondrites gave the same SWSAE as ours (Noble et al. 2011). Meanwhile, npFe0 has been found in irradiated OCs (Noble et al. 2011; Wu et al. 2017; Tai et al. 2021). As the representative SW product, npFe0 is well known to darken and redden spectra in the VIS-NIR region for smaller size particles; however, it is also known to darken but not redden in the case of larger size particles (Noble et al. 2007; Lucey & Noble 2008). Despite the fact that we did not perform microanalysis for our two OCs in this study and considering npFe0 has been found in many similar experiments, we expect to see npFe0 arising and causing darkening and reddening in Figs. 1a and f. In addition, similar to our result, another laser irradiation study for CV3 Allende also gave the darkening and reddening result, and npFe0 was produced (Gillis-Davis et al. 2017). These details suggest that OCs and CV chondrites follow the SW of the “lunar model.”
Another laser irradiation experiment for CO chondrite also showed the darkening and reddening spectral alteration effect (Hiroi et al. 2013), consistent with our result. Although we did not observe npFe0 in irradiated CO3 Shanshan 002, we found a large number of npFeNi particles. Considering npFeNi particles can also darken and redden spectra (Britt & Pieters 1994), we tend to support the notion that those npFeNi particles contribute to the same spectral alteration effect as npFe0 in CV chondrite.
Besides two ion implantation experiments for enstatite (Jäger et al. 2003; Takigawa et al. 2019), there seems to be a lack of additional studies on SW of aubrites. As mentioned above, although our Aub Norton County shows the same SWSAE as OCs and CV/COchondrites, except for the thick amorphous layer, we did not observe any iron-bearing nanoparticles. We hence tend to support that amorphization of enstatite mainly darkens and reddens virgin spectrum, just like the amorphous rim found in lunar samples (McKay et al. 1991).
4.2.2 Brightening and reddening and the role of melting and sputtering of metal
Considering the abundant metals in two EH4 meteorites and observed melting and sputtering of metal, the changes in the behavior of metals probably play a key role in brightening and reddening. During laser irradiation, originally separated metal grains were melted, then they flowed, and grew into a larger area, increasing the metallic proportion on the surface. Meanwhile, subsurface metals were exposed and sputtered to the surface, increasing metal abundance on the surface. More metal on the surface hence causes the brighter and redder spectra (Zhang et al. 2020). Of course, we cannot completely rule out the contributionfrom amorphization of enstatite in ECs, which provides an opposite spectral effect on reflectance, namely darkening, as revealed by our Norton County sample. We infer that SWSAE of ECs may be comprehensively affected by melting and sputtering of metal and amorphization of enstatite, where the former dominate the “brightening and reddening” in metal-rich ECs, such as our EH4 meteorites. Conversely, the darkening and reddening caused by the amorphization of enstatite may take place on relatively metal-poor ECs, such as EL chondrites. One ion implantation experiment (generally can only cause amorphization) for EL6 Eagle has given a darker and redder SWSAE (Vernazza et al. 2009). This reminds us that the relative proportions of metals and iron-free (or poor) silicates (e.g., enstatite and forsterite) may be an important factor affecting SWSAE in an enstatite or forsterite-metal mixed system.
4.2.3 Multistage SWSAE on CM
As opposed to our brightening and bluing result on CM Murchison, previous other simulated experiments gave varied results (Matsuoka et al. 2015, 2020; Thompson et al. 2019, 2020; Lantz et al. 2015), introducing additional uncertainty. In particular, because Murchison may be the daughter derived from the initial state of Bennu and Ryugu, a deep understanding of its SW becomes more important in grasping the spectral variations (Sugita et al. 2019; DellaGiustina et al. 2020) and the evolution history of these two bodies. Combining the results from heating and laser irradiation experiments on different Murchison samples (Hiroi et al. 1993; Matsuoka et al. 2015, 2020), and considering that laser irradiation significantly contributes to thermal metamorphism, now we can sort out roughly spectral thermal response paths on CM (Fig. 7). Although heating and laser irradiation reproduce two different surface alteration processes on asteroids – namely, slow heating from solar radiation and fast heating-cooling from micrometeoroid bombardments (Pieters & Noble 2016) – both heating and laser irradiation contribute to thermal metamorphism and could more realistically reflect SWSAE on asteroids.
The spectral thermal response paths on Murchison can be decomposed into three stages. As shown in Fig. 7a, at the low degree of heating stage (temperature is lower than 500°C), both visible reflectance R0.55 (absolute reflectance at 0.55 μm) and near-infrared slope R1.8/R0.75 (ratio of absolute reflectance at 1.8 μm to that at 0.75 μm) decrease as temperature increases, that is darkening and bluing. At the medium degree of heating stage (temperature is between 500 and 1000°C), as the temperature increases, R0.55 shows an increasing trend while R1.8/R0.75 continues to decrease, that is brightening and bluing. Although R0.55 shows an increasing trend at this stage, it was still lower than the value of unheated Murchison, showing a darker and bluer spectrum than the initial sample. At the high degree of the heating stage (temperature of 1000°C), the R0.55 of heated sample is already greater than for the unheated sample, meaning a brighter spectrum than the initial sample. Meanwhile, the value of R1.8/R0.75 (0.9972) is less than 1 at this stage, suggesting a bluish near-infrared slope. Despite the lack of heating at higher temperatures for Murchison, considering the near-infrared slope bluing and visible reflectance brightening trend at the mediumand high degree of heating stages, it is foreseeable that samples subjected to heating above 1000°C should eventually show brighter reflectance and bluer near-infrared slope than heating at 1000°C. That is probably why different studies gave various SWSAE: laser irradiation in Matsuoka et al. (2015, 2020) for Murchison (see Fig. 7a) may simulate the low degree of SW (the lower SW degree in this study means the thermal metamorphism degree caused by laser irradiation for meteorites or impact for asteroids is lower, which can be contributed by the lower laser energy and fewer laser shots for meteorites, or lower impact velocity, lower impact flux, or the shorter impact history for asteroids) and thus show the darkening and bluing trend (0.7–15 mJ), consistent with the low degree of heating stage. Laser experiments in Thompson et al. (2019, 2020) for Murchison may simulate low to medium degree of SW, thus first showing darkening and bluing trend (48 mJ × 1 shot), and then second brightening, but the irradiated samples are still darker than the unirradiated ones (48 mJ × 2 shots, 48 mJ × 5 shots). We simulated the high degree of SW in this study (see Fig. 7a), showing the brighter visible reflectance than unirradiated and blue near-infrared slope (28 mJ × 10 shots), equivalent to the high degree of heating stage.
In Fig. 7b, we show how the reflectance of Murchison in the ultraviolet region varies with SW degree and what the difference is between the ultraviolet reflectance and visible reflectance change with SW degree. Here, ΔR0.35 and ΔR0.45 are reflectance differences at 0.35 μm (ultraviolet band) and at 0.45 μm (visible band) of samples after and before heating or laser irradiation, respectively (irradiated minus virgin). At stage I (temperature is lower than 500°C or the laser energy is lower than 5 mJ), ΔR0.35 and ΔR0.45 are both negative, and as heating or the SW degree becomes stronger, ΔR0.35 increases but ΔR0.45 decreases, indicating that although heated or irradiated samples are still darker than virgin samples, ultraviolet reflectance shows an increasing trend (similar to R0.55 changes at medium degree of heating or SW stage in Fig. 7a), while the visible reflectance maintains a decreasing trend (similar to R0.55 changes at low degree of heating/SW stage in Fig. 7a). At stage II (temperature is between 500 and 700°C), ΔR0.35 and ΔR0.45 are still negative, but both increase as temperature rises, indicating that ultraviolet and visible reflectance both show an increasing trend as heating or SW becomes stronger. At stage III (temperature is between 700 and 900°C or laser energy is between 5 and 15 mJ), ΔR0.35 becomes positive, while ΔR0.45 remains negative, indicating that heated or irradiated samples in the ultraviolet region are brighter than virgin samples, but in the visible region is still darker than the virgin. As the degree of heating or SW continues to increase to stage IV (temperature is about 900 or 1000°C or laser energy is 28 mJ × 10 shots), ΔR0.45 turns positive, showing a higher ultraviolet and visible reflectance than the virgin sample. For heating and irradiation in stage I, differing from ΔR0.45, ΔR0.35 did not first decrease but instead directly increases. The four-stage paths reveal that reflectance changes with SW degree in the ultraviolet region are more sensitive than in the visible region, and ultraviolet reflectance can preferentially brighten than visible reflectance when undergoing SW.
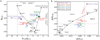 |
Fig. 7 Multistage SWSAE model of Murchison given by heating and laser irradiating experiments. (a) SWSAE of Murchison revealed by R0.55 (absolute reflectance at 0.55 μm) changes and near-infrared slope R1.8/R0.75 (ratio of absolute reflectance at 1.8 μm to that at 0.75 μm) changes. It suggests that SWSAE is not simply reddening or bluing but related to the SW degree: as the SW degree becomes stronger, first it darkens and becomes bluer then brightens and continues to become bluer. Small black symbols represent heated data come from Hiroi et al. (1993). Large symbols represent laser irradiated data, where solid symbols represent unirradiated and open symbols are irradiated. The purple symbols represent data obtained in this study; the other irradiated data related to Murchison (size <63 μm) come from Matsuoka et al. (2015, 2020); (b) SWSAE of Murchison on the ultraviolet and visible region. It suggests that as the SW degree becomes stronger, Murchison brightens initially in the ultraviolet region (0.35 μm band), and then in the visible region (0.45 μm band). The vertical axis (ΔR0.35) represents the value of reflectance at 0.35 μm of heated or irradiated minus unheated or unirradiated sample, and the horizontal axis (ΔR0.45) represents the value of reflectance at 0.45 μm of heated orirradiated subtract unheated/unirradiated sample. The red shot-dotted line (Trend line) is a suppositional evolution path for the irradiated Murchison from stage III (first quadrant) to stage IV (second quadrant). |
4.2.4 Comprehensive phase transformation effects on CM
For Murchison, the three-stage SWSAE model in Fig. 7a may be related to alteration of organics, volatiles, and phyllosilicates caused by SW or heating. For unheated and unirradiated Murchison, they show a red near-infrared slope and absorption of Fe-bearing phyllosilicates at 0.7 μm (Hiroi et al. 1993; Thompson et al. 2020; Matsuoka et al. 2020). At the low degree of heating and SW stage, although partial amorphization of phyllosilicates occurs (Matsuoka et al. 2020; Lindgren et al. 2020; King et al. 2021), the carbonization of organics (Moroz et al. 2004; Thompson et al. 2020) may mainly contribute to darkening and bluing (Cloutis et al. 1994, 2011). At the medium degree of heating and SW stage, carbon formed in carbonization process may have been partially taken away by the release of volatiles or been oxidized to gas and then lost, causing an increasing trend of visible reflectance. Meanwhile, the dehydroxylation of phyllosilicates process will dominate the system, that is, the phase sequentially evolves along amorphous phyllosilicates, recrystallized Fe-bearing forsterite, and amorphous enstatite (Lindgren et al. 2020; King et al. 2021), thus making the spectra brighter and bluer than the low degree of heating and SW stage, as well as weakening of 0.7 μm band (Thompson et al. 2020; Matsuoka et al. 2020). The dehydroxylation of phyllosilicates generally begins at 400–500°C (Lai et al. 2003; Lindgren et al. 2020) and is completely converted to Fe-sulphides (King et al. 2021) and recrystallized Fe-bearing forsterite (Lindgren et al. 2020) at 750–800°C; thus the 0.7 μm absorption of phyllosilicates in Murchison shown in Hiroi et al. (1993) and in this study (Fig. 1e) has been completely lost at the high degree of heating stage. At this time, like heating terrestrial antigorite at 1050°C (Lai et al. 2003), the system of Murchison should be dominated by Fe-bearing recrystallized forsterite and recrystallized enstatite, causing brighter visible reflectance and a bluish near-infrared slope, as in the unirradiated Norton County shown in Fig. 1b. The new absorption band near 1 μm (0.965 μm in Fig. 1e) proves the regeneration of Fe2+-bearing silicate, while the wide absorption between 1 and 1.47 μm in Fig. 1e is similar to the undefined absorption between 0.8 and 1.3 μm reported in heated CM and CI CCs (Cloutis et al. 2012). Besides carbonization of organics, loss of carbon, and dehydroxylation of phyllosilicates, some intermediate products in the heating or SW process, such as magnetite and iron-sulfur-rich material (Matsuoka et al. 2015, 2020; Thompson et al. 2019, 2020; Lindgren et al. 2020; King et al. 2021), may also weakly affect spectra, although only a very small extent.
Heating medium volatility bituminous coal has revealed that carbon can be lost at 450°C and the reflectance within 200–500 nm region increases with increasing heating time (Applin et al. 2018). Mixing lampblack with phyllosilicates revealed that an increase in carbon content could decrease the ultraviolet?visible reflectance (Cloutis et al. 2011). Hence, the negative ΔR0.35 and ΔR0.45 in stage I and II (Fig. 7b) should be contributed by created carbon from carbonization of organics, while the increasing trend of ΔR0.35 should be caused by loss of created carbon. As for the reflectance preferentially brightening in the ultraviolet rather than the visible region as heating and the SW degree increases, it is not yet entirely clear. This may be because the created carbon in the top of the surface layer is lost earlier than the bottom due to the release of volatiles (as shown in Fig. 6f, the top of the surface layer and edge of the sample are dominated by the larger size of burst bubbles, while the bottom of surface layer has the smaller size of unbroken bubbles). Meanwhile, ultraviolet light has a shallower penetration depth (collects only the signals from the top of the surface layer) than visible light (also collecting the signals from the bottom of the surface layer). Thus, for that ΔR0.45 first decreases while ΔR0.35 does not at first decrease in stage I, perhaps is because, at this time, the top of the surface layer has begun to lose created carbon via the release of volatiles, while the bottom of the surface layer still accumulates carbon by evaporation from inside.
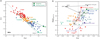 |
Fig. 8 Potential transformation trends of asteroidal spectral types driven by SW: (a) transformation trends of asteroidal spectral types on the S-complex. Unirradiated H6 and LL5/6 ordinary chondrites (large solid symbols) are the best match for Q-types, while after irradiation, they tend to move toward Sq- and S-types, indicating an evolution trend of “Q-Sq-S” driven by SW. The line α was definedin DeMeo et al. (2009) and used to separate S-complex from other types. The vertical axis PC1’ (first principal component) and horizontal axis PC2’ (second principal component) are also calculated based on DeMeo et al. (2009). For background on our choice to use PC1’ and PC2’ here, we refer to Appendix C. All of the near-Earth objects (NEOs) data come from Binzel et al. (2019); (b) Transformation trends of asteroidal spectral types on carbonaceous composition. The unheated and unirradiated Murchison are close to the Ch and Cgh-type area, and as heated temperature and irradiated energy increases, they generally move toward the B-type and ultimately fall into the B-type range, revealing that a Ch or Cgh-type could become a B-type due to SW. The vertical axis Slope0.85−1.8 is the linear fitting slope within 0.85–1.8 μm region, and the values of horizontal axis PC4’ (fourth principal component) are calculated on the basis of DeMeo et al. (2009). For the reason we use Slope0.85−1.8 and PC4’ here, please see Appendix C. For data on the asteroids used here, we refer to Table D.1. |
5 Implications for SW on asteroids
5.1 Anhydrous silicate asteroids: S-, K-, and E-types
S-type asteroids were named after their stony composition and are mainly composed of mafic minerals (e.g., olivine and pyroxene) (Tholen 1984). They have proven to be the source of ordinary chondrites via analyses of the returned samples of asteroid (25143) Itokawa (Nakamura et al. 2011). Just as in the case of the irradiated OCs, npFe0 has also been observed on Itokawa particles (Noguchi et al. 2011, 2014; Matsuoka et al. 2015). Another S-type asteroid (433) Eros visited by the NEAR Shoemaker spacecraft also shows the darkening and reddening SW effect (Clark et al. 2001). These examples support the consistency of SW processes among the lunar model and S-type bodies.
K-type asteroids were proposed as a typical S-type but more closely resemble C-type (Bell 1988). They generally show a wide absorption band centered just longward of 1 μm; the left maximum and the minimum are sharply pointed, and the walls of the absorption band are linear with very little curvature (DeMeo et al. 2009). Based on spectral comparison, CV and CO chondrites are shown to be the best match to K-type asteroids (Bell 1988; Hiroi et al. 1994; Burbine et al. 2001; Shepard et al. 2008; Clark et al. 2009). Up to the present, although no K-type asteroids have been visited, our irradiation for Allende and Shanshan 002 indicates that the K-type may hold the same spectral alteration effect as the Moon and S-type, and the SW products, namely, npFe0 and npFeNi particles, are expected to be found on their surface.
E-type asteroids refer to objects with the highest brightness (geometric albedo greater than 0.3) and generally without any absorption characteristics (Tholen 1984). They were initially classed into the X-class with M- and P-types in Tholen taxonomy (Tholen 1984). E-type asteroids are dynamically located in two areas: Hungaria region from 1.88 to 1.98 AU (the astronomical unit, 1 AU is approximately the Earth–Sun distance); and the inner main belt region from 2.10 to 2.72 AU (Clark et al. 2004). They represent igneous bodies formed in a reduced anhydrous environment close to the Sun (Keil 1989). Although the Rosetta spacecraft has flown by the E-type asteroid (2867) Steins (Nedelcu et al. 2007), the SW on E-type bodies is still not very clear. Aubrites, as one kind of iron-free or iron-poor meteorite mainly composed of enstatite (Watters & Prinz 1979; Watters et al. 1980), have been thought to be the best candidate to match E-type asteroids based on their spectral similarities (Zellner et al. 1977; Gaffey et al. 1992; Fornasier & Lazzarin 2001; Keil 2010). Our irradiation for Norton County implies that E-type asteroids may become darker and redder after micrometeoroid bombardments. Since there is a possible lack of sufficient metal and easily amorphous enstatite, the production of Fe-bearing nanoparticles on E-types should not be expected as on the Moon and S-type. Of course, completely excluding the contribution of Fe-bearing nanoparticles may be unwise. In contrast to laser irradiation (lasers cannot introduce exotic material), some Fe-bearing impactors (such as S-types, M-types, and so on) may bring in the Fe element and produce fine Fe-bearing particles to affect their spectra. In addition, some E-type asteroids show weak absorption characteristics and have been classed into three subtypes by Gaffey & Kelley (2004): E[I] (featureless), E[II] (has 0.49 μm absorption) and E[III] (has 0.9 μm absorption), indicating the potential various composition on the surfaces of E-types. A compositional model given by Clark et al. (2004) based on VIS-NIR spectra study also supports the diversity of composition on E-types: “Nysa-like” E-types are consistent with silicate mineralogy higher in iron than the mineral enstatite; “Angelina-like” E-types are consistent with silicate mineralogy, including a sulfide such as oldhamite; and “Hungaria-like” E-types are not inconsistent with aubrites. Therefore, considering the diverse composition of E-types, the SWSAE and cause of E-type asteroids we discussed in this paper only refer to the parent bodies of aubrite.
5.2 Metal-rich asteroids: M-types
M-type asteroids were named after metal composition in Tholen taxonomy (Tholen 1984). As the second closest group to the Sun (Gradie & Tedesco 1982), M-types generally show medium geometric albedo (0.1–0.3), red spectral slope over 0.34–1.04 μm region, and featureless spectra (Tholen 1984). Based on spectral similarities, M-type asteroids have been linked to ECs and iron meteorites (Chapman & Salisbury 1973; Gaffey 1976; Bowell et al. 1978; Gaffey & McCord 1978; Cloutis et al. 1990; Gaffey et al. 1993). To distinguish them, we recommend using the term “Me” to represent the parent bodies of ECs and adopting “Mm” to denote source bodies of iron meteorites, as previously proposed by Earth-based radar studies (Shepard et al. 2010). There is a lack of direct SW observations on M-type bodies, so here our laser experiment for two EH4 meteorites provides a good opportunity to glimpse possible SW on Me-types. As in our spectral and microscopic observations in ECs, the melting or sputtering of metal may dominate the spectra and cause brightening and reddening on metal-richer Me-types. For enstatite-richer Me-types, perhaps similar to irradiated Norton County, the amorphization of Fe-poor or free silicates mainly causes darkening and reddening. Because we did not irradiate iron meteorites in this study, we cannot make predictions for Mm-types for now; however, during the impact process, the behavior of metals observed in two EH meteorites, namely melting, sputtering, and evaporation, may play a significant role in affecting spectra of Mm-type and is worthy of attention in the future.
5.3 Volatiles-rich carbonaceous asteroids: Ch-, Cgh-, and D-types
Primitive carbonaceous bodies refer to the C-complex (contains C-, Ch-, Cg-, Cgh-, and Cb-types) and B-type in Bus-DeMeo taxonomy (Bus & Binzel 2002; DeMeo et al. 2009) or B-, C-, F-, and G-types in Tholen taxonomy (Tholen 1984). They generally show low albedo and linear spectra and have been linked to CCs based on the similarity of spectra, in which CM chondrites were connected to Ch- and Cgh-types due to the appearance of 0.7 μm absorption band (Vernazza et al. 2016). Hence, we infer that the multistage SWSAE for Murchison may also appear on Ch- and Cgh-type asteroid surfaces, that is, first there is a darkening and bluing due to the carbonization of organics and then a brightening and bluing due to the loss of created carbon and dehydroxylation of phyllosilicates. This means that even for the same Ch- or Cgh-type asteroid, a regional difference in SW degree may cause variations in reflectance and spectral slope. In addition, we infer that the characteristics of the bubbles found in irradiated Murchison samples can possibly exist widely on the mineral surfaces of Ch and Cgh asteroids.
D-type asteroids are mainly distributed near Jupiter’s orbit (DeMeo & Carry 2014), which are considered to be primitive and the best match to a C2 ungrouped carbonaceous chondrite Tagish Lake (Hiroi et al. 2001). One low energy laser irradiated experiment for Tagish Lake showed a darkening and bluing SWSAE (Hiroi et al. 2013). Although we did not irradiate Tagish Lake in this study and lack more laser irradiation experiments for it, because of its abundant organics, phyllosilicates, and volatiles (Pizzarello et al. 2001), it is foreseeable that the multistage SWSAE model in Murchison and Ch and Cgh-types may also occur on Tagish Lake and D-type asteroids. This means that some D-types may become relatively bluer in the near-infrared region and show diverse albedo after suffering SW processes, or the emergence of regional variations in reflectance and spectral slope on the same asteroid due to the heterogeneity of the SW stage, just as in the case of the red and blue units found on Phobos (Basilevsky et al. 2014; Pieters et al. 2014).
5.4 Ryugu and Bennu
As in the case of irradiated Murchison samples in Fig. 7a, both Ryugu and Bennu showed the regional variations in reflectance and spectral slope (Sugita et al. 2019; DellaGiustina et al. 2020). In addition, the most recent observation from asteroid Bennu suggests that freshly exposed surfaces will initially brighten in the ultraviolet bands and then brighten in the visible to near-infrared bands (DellaGiustina et al. 2020), which is consistent with our results shown in Fig. 7b. These seem to indicate that the multistage SWSAE and comprehensive phase transformation effects seen for Murchison may indeed have taken place on the surfaces of Ryugu and Bennu. This allows us to better understand their SW effect and surface evolution history.
The artificial impact experiment on asteroid Ryugu showed that the fresh material excavated from the subsurface is darker than the mature surface regolith, as R0.55 decreases by ~20% (Arakawa et al. 2020). Based on this result, if we only consider micrometeoroid bombardments or solar heating to alter spectra of Ryugu, and if Murchison indeed originates from the initial (unheated) parent body of Ryugu; at the same time, if the subsurface really has been heated to ~300°C (Kitazato et al. 2021), compared to the subsurface, surface materials of Ryugu may have subsequently undergone thermal metamorphism of 700–1000°C (the reason for not exceeding 1000°C is that Ryugu still maintains a reddish near-infrared slope, and the cause for about or exceeding 700°C is because we assume the lower limit of R0.55 range at 300°C is the same as R0.55 at 400°C, see Fig. 7a). This is slightly higher than the thermal metamorphism temperature of 300–700°C estimated by the thermal model in Kitazato et al. (2021). In addition, by considering that the surface of Ryugu does not show significant absorption at 0.7 μm but does show a wide weak absorption feature from 0.8 to 1.4 μm (Perna et al. 2017), based on the phase analysis of heating experiments in CM chondrites (Hiroi et al. 1993; Lindgren et al. 2020; King et al. 2021), phyllosilicates (Lai et al. 2003), and organics (Applin et al. 2018), as well as laser experiments on Murchison (Thompson et al. 2020; Matsuoka et al. 2020), the thermal metamorphism on Ryugu’s surface may have exceeded at least 800°C. These details indicate that Ryugu’s surface may have undergone thermal metamorphism from 700 (or 800) to 1000°C. A dynamical model has revealed that such a high-temperature thermal metamorphism caused by solar heating is likely to take place when Ryugu approaches the Sun during orbital evolution (Michel & Delbo 2010).
For Bennu, if its initial (unheated) parent body is indeed the source of CM chondrites and if the blue near-infrared slope on Bennu’s surface (Clark et al. 2011) is entirely contributed by solar heating (a dynamical model from Delbo & Michel (2011) has shown that solar radiation is like to cause the thermal metamorphism with a surface temperature exceeding 327°C) or micrometeoroid bombardments, on the basis of Murchison in Fig. 7a, the blue slope would require a high degree of SW or heating (heating temperature of about or higher than 1000°C). In that case, Bennu would be expected have a slightly brighter visible reflectance than Ryugu. This is consistent with the observation that Bennu has a global geometric albedo of 0.044 ± 0.002 at 0.55 μm (DellaGiustina et al. 2019) while Ryugu shows a global geometric albedo of 0.04 ± 0.005 at 0.55 μm (Tatsumi et al. 2020). However, Bennu shows a stronger –OH absorption (Hamilton et al. 2019) than Ryugu (Tatsumi et al. 2020) at 2.7 μm and does not show the wide absorption between 0.8 and 1.4 μm (Clark et al. 2011). Hence, it is also possible that Bennu did not experience higher thermal metamorphism by solar heating or SW than Ryugu, whose higher albedo and blue near-infrared slope may be related to material heterogeneity (DellaGiustina et al. 2020) and caused in part by the appearance of carbonate (e.g., calcite and magnesite) (Gaffey 1976; Cloutis et al. 2010), since carbonate veins have been distinguished on Bennu (Kaplan et al. 2020).
6 Transformation trends of spectral types driven by SW
As in the case of the Moon and the S-type Itokawa, long-term SW may be shown to significantly remodel asteroid surfaces. Consequently, composition information derived from VIS-NIR spectra may reflect only the altered regolith, rather than any natural materials. In other words, SW plays an important role in driving the transformation of spectral types. A recent comparative study based on collected meteorite spectra and asteroid spectra presented the possible transformation trends among D-, B-, C-types, and X-complex (Lantz et al. 2018). Here, our two virgin OCs are the best matches to Q-type asteroids; after irradiation, they tend to move toward Sq- and S-types (Fig. 8a). This indicates that the Q-type as the source of OCs (McFadden et al. 1985; Binzel et al. 1996), when refreshed by planetary encounters, asteroid collisions, YORP spinup, or thermal cycling (DeMeo et al. 2014; Binzel et al. 2019), it probably still maintain a young surface, and some of them can transform to Sq- and S-types as SW degree increases. The “Q to S” transformation trend has also been astronomically observed (Thomas et al. 2011). When comparing Murchison with primitive carbonaceous asteroids, a “Ch or Cgh to B” trend can be seen in Fig. 8b, which indicates that Ch- and Cgh-types could ultimately become B-type when undergoing long-term SW. This trend ought to be the subject of testing in future astronomical observations.
7 Conclusions
In this study, we systematically irradiated OCs, Aub, ECs, and CV, CO, and CM chondrites at high laser energy. Their spectral alteration effects and causes were investigated in detail. Comprehensively considering our experiments and others reported in the literature, meteorite-asteroid linkage, and the asteroid spectra, we conclude that:
Space weathering spectral alteration effects (SWSAE) and causes are closely related to the relevant natural composition: darkening and reddening can occur on anhydrous silicate asteroids (such as S-, E-, and K-types), and npFe0, npFeNi particles, and the amorphization of silicates are the main causes; brightening and reddening might take place on metal-rich M-type asteroids, such as (16) Psyche, while melting and sputtering of metal are the main causes;
For volatile-rich carbonaceous asteroids, such as Ch-, Cgh- and D-types, SWSAE and causes are related to SW degree: darkening and bluing can occur at a low degree of SW then brightening and continue bluing as SW degree increases, wherein the comprehensive phase transformation effects, such as carbonization of organics, loss of carbon, and dehydration of phyllosilicates control the spectral changes;
Due to the sensitivity of spectral alteration effects to SW degree in volatile-rich carbonaceous asteroids, the various spectral units on Ryugu, Bennu, and Phobos may be the results of heterogenetic SW. The spectral heterogeneity may be a universal phenomenon on more similar bodies, leading to variations on albedo and spectral slope;
For CM chondrite and their parent bodies, reflectance changes with SW degree in the ultraviolet region is more sensitivethan in visible region; and ultraviolet reflectance can brighten prior to the than visible reflectance when undergoing SW;
Long-term SW can drive the transformation of asteroid spectral types along “Q-Sq-S” and “Ch (or Cgh)-B” trends.
Although we have simulated as many types of asteroids as possible in this study, there are still broad types that are not covered here, such as the mysterious P-type and L-type. Despite this, our study has revealed the diversity of SW on spectral alteration effects and causes. In this study, only slab or fragment samples were used, hence, our discussion about SW on asteroids may be more applicable to the objects composed of coarse regolith rather than fine soil. In the future, the use of compacted powder may be able to simulate the SW on asteroids with abundant fine regolith more realistically. Further simulated experiments and asteroid observations will continue to promote the understanding of this issue. In particular, comprehending the diversity of SW on asteroids is helpful for improving the understanding of the evolution of asteroid regoliths and the transformation of spectral types driven by SW. This allows us to identify various types of young and weathered bodies. Furthermore, it helps to map the distribution of natural composition in space (Gradie & Tedesco 1982; DeMeo & Carry 2014) to test and modify current formation and evolution models of the Solar System.
Acknowledgements
The authors would like to thank Francesca E. DeMeo for a very beneficial discussion on asteroid taxonomy, and thank Ziliang Jin for helpful discussion on the water content of ordinary chondrites. We acknowledge Changqing Liu and Mutong Niu for help in spectral measurement and micro-observation respectively. We also thank Siyuan Zhang and Xu Ren for providing partial mineralogical investigations in meteorites Shanshan 002 and Murchison, respectively. In addition, we are grateful to Wenzhe Fa and Mingming Zhang for helping to improve the original manuscript. Y.L. wants to thank funding support from Strategic Priority Research Program of the Chinese Academy of Sciences grant XDB 41000000 and XDA 15020300; Natural Science Foundation of China grant 41673071 and 41931077; Technical Advanced Research Project of Civil Space grant D020201; Youth Innovation Promotion Association CAS grant 2020395; Key Research Program of Frontier Sciences, CAS, Grant QYZDY-SSW-DQC028; and Guangxi Scientific Base and Talent Special Projects grant AD1850007.
Appendix A Sample description
Xingyang: H6 ordinary chondrite observed falling in Xinyang, China in 1977. Our sample is a fresh fragment. The mineralogy analysis shows that it is mainly composed of 30.74 wt% olivine, 34.18 wt% pyroxene, 7.68 wt% plagioclase, 20.09 wt% FeNi metal, and 5.45 wt% troilite (Tao et al. 1979).
Kheneg Ljouâd: LL5 or LL6 ordinary chondrite, which fell in southern Morocco in 2017. The petrography analysis shows that it contains recrystallized chondrules integrated in a matrix. The metal and troilite are heterogeneously distributed across the volume, andthe metal is mainly tetrataenite. Metal and troilite occupy <2 vol% in this meteorite (Gattacceca et al. 2019).
Norton County: Aubrite (or enstatite achondrite) observed falling in the United States in 1948. Our sample is a fresh fragment. The mineralogy analysis shows that it is composed of 84.5 vol% enstatite (En98.76Fs0.10Wo1.12), 10 vol% forsterite (Fo99.99), 2.7 vol% diopside, 1 vol% plagioclase, 1 vol% troilite, and 0.3 vol% kamacite (Watters & Prinz 1979).
Allende: CV3 carbonaceous chondrite observed falling near Parral, Chihuahua, Mexico in 1969. This meteorite is composed of 57 vol% matrix and 43 vol% inclusions (Fendrich & Ebel 2021). Our sample is a fresh thick slab, including a lot of white circular chondrules with sizes from 1 to 3 mm. The recrystallized and barred chondrules mainly are low-Fe olivine (Fa0.3−17.1), while the single crystals of olivine have a wide range of iron content (Fa0.3−49) (Simon & Haggerty 1979).
Shanshan 002: CO3 carbonaceous chondrite found in Shanshan County, Xinjiang, China in 2017. This meteorite has not been reported in any literature. Our sample is a fresh fragment. Our mineralogy analysis shows that Shanshan 002 is composed of 48 vol% chondrules, 5 vol% refractory inclusions, 5 vol% FeNi metal and sulfide, and 32 vol% matrix. The chondrules generally are circular or elliptical, and their diameters range from 0.05 to 0.62 mm. The main minerals in chondrules are olivine (Fa1−73), pyroxene, plagioclase, and metal. The Fa value of olivine in the matrix changes from 0 to 45. The olivine and pyroxene contain rare nickel (0.01–0.06 wt% and 0.02–0.42 wt%, respectively). The refractory inclusions are mainly composed of fine spinel, melilite, and anorthite. Metals are distributed in chondrules and the matrix, and the FeNi metal, troilite, and magnetite generally aggregate to form larger particles. The matrix is mainly composed of mineral fragments (olivine, pyroxene, and plagioclase), amorphous silicate, FeNi metal, sulfide, and organics.
Abee: EH4 enstatite chondrite observed falling North of Edmonton, Alberta, Canada in 1952. Our sample is a fresh thin slab, and a large amount of scattered fine-size metal can be seen on the polished surface of the sample. Our analysis shows that the main mineral of Abee is enstatite (En94.85−100Fs0−5.14) followed by FeNi metal and troilite. The abundance of enstatite in different clasts is 22–41 wt%, in matrix is 46–52 wt%, and in dark inclusion is 37 wt%; the content of FeNi metal in different clasts is 22–65 wt%, in matrix is 20–30 wt%, and in dark inclusions is 6 wt% (Rubin & Keil 1983).
Indarch: EH4 enstatite chondrite observed falling in Azerbaijan in 1891. Our sample is a fresh thin slab, and a large number of scattered fine-size metal fragments can be seen on the polished surface of the sample, like Abee. Our analysis shows that the main mineral is enstatite (En86.88−100Fs0.029) followed by FeNi metal and troilite.
Murchison: CM2 carbonaceous chondrite observed falling in Murchison, Victoria, Australia in 1969. Our sample is a fresh thin slab. Our mineralogy analysis shows that it is mainly composed of about 25 vol% chondrules and 73.4 vol% matrix. In our sample, the chondrules are generally circular or elliptical, and their diameters are from 0.2 to 1 mm. Chondrules include olivine (Fa0−40), low-Ca pyroxene, and a low amount of FeNi metal and sulfide. The matrix is mainly composed of phyllosilicates, such as serpentine and chlorite.
Iron content in main silicate crystals and water content in bulk rock of partial meteorites used in this study
Appendix B SW age estimation
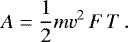
We assume that all kinetic energy from micrometeoroid bombardments on asteroids is converted into heat and the micrometeoroid flux does not change with time. Based on this assumption, we can roughly calculate how long our simulated experiment is equivalent to SW timescales on asteroids. At a distance of 1 AU, the impact flux of dust particles with diameter ~10−6 m (~10−15 kg) is about 10−4 m−2 s−1 (Grün et al. 1991). If we assume the impact average velocity for each dust particle on asteroids is 1.5 × 10⁴ m s−1, the deposited energy per square meter per year on the surface will be 3.5478 × 10⁻⁴ J (Eq. (B.1)). The total deposited energy per square meter in our experiment is about 3.56688 × 10⁸ mJ (Eq. (B.2)). Then we can estimate the simulated SW age is ~109 yr (Eq. (B.3)):
 (B.1)
(B.1)
Here, A is the deposited energy per square meter per year on asteroids. The mass of each dust particles m is 10−15 kg. The impact velocity v is 1.5 × 10⁴ m s−1. The impact flux F is 10−4 m−2 s−1, and the impact time T is 365 × 24 × 3600 s.
 (B.2)
(B.2)
Here, 0.28 is total deposited energy during 10 shots in each spot, it’s unit is J. B is the energy density (total deposited energy per square meter in our experiment), and the radius of each laser spot r is 5 × 10⁻⁴ m.
 (B.3)
(B.3)
Finally, the simulated SW age C is calculated in units of years.
Appendix C Data analysis
To quantitatively characterize the SWSAE for Murchison, we introduce several spectral parameters in Table 1. R0.55 is the absolute reflectance at 0.55 μm, which represents the visible absolute reflectance. R2.45/R0.75 is the ratio of absolute reflectance at 2.45 μm to that at 0.75 μm, which reflects the overall slope in near-infrared region. We used the software ENVI (5.3.1 version) to calculate the absorption center and band depth: (1) import the spectral data (extension is .txt) using the “Display–Spectral Library Viewer–Import–ASCII” option; (2) remove the continuum using the “Continuum Removed” option, this option uses the algorithm described in Clark & Roush (1984); (3) in the absorption bands, the wavelength corresponding to the lowest value of the vertical axis is the absorption center, and the band depth is the value that 1 minus the lowest value of the vertical axis in the absorption bands.
We also introduce several spectral parameters in Fig. 7: R1.8/R0.75 in Fig. 7a is the ratio of absolute reflectance at 1.8 μm to that at 0.75 μm, which reflects the near-infrared slope. One reason we used R1.8/R0.75 is that the virgin Murchison sample generally shows a convex curve in the near-infrared region (slopes on the left and right sides of 1.8 μm are quite different). Another reason is that Murchison does not show absorptions at 0.75 μm and 1.8 μm. To compare the difference of reflectance changes with SW or heating degree between ultraviolet and visible region, we investigate the reflectance at 0.35 μm and 0.45 μm: we use the parameter ΔR0.35 to represent the value of reflectance at 0.35 μm for the heating or laser irradiated sample minus the virgin sample, and ΔR0.45 to represent the value of reflectance at 0.45 μm for the heating or laser irradiated sample minus the virgin sample. ΔR0.35 can approximately represent the reflectance alteration in the ultraviolet region, and ΔR0.45 can approximately reflect the reflectance alteration in the visible region.
To study how SW affects the transformation of spectral types, we compare spectral data of asteroids with our partial meteorites in Fig. 8. The asteroidal principal component values PC1’ and PC2’ in Fig. 8a were collected from Binzel et al. (2019); PC1’ and PC2’ of our meteorite sample were computed by the asteroid taxonomy online tool from the MIT web1. The lablels PC1’ and PC2’ are used here because they are useful for separating S-class asteroids from other types and were also useful for separating Q-, Sq-, and S-types (DeMeo et al. 2009). Due to a lack of data at 0.75 μm in the asteroid near-infrared spectral files, and since 0.85 μm is close to 0.75 μm, we used Slope0.85−1.8 (slope between 0.85 and 1.8 μm) to describe the spectral slope as shown in Fig. 8b. We note that the Slope0.85−1.8 out of all meteorites in Fig. 8b was not based on the absolute reflectance, but was based on the normalized reflectance at 1.215 μm. This is because the asteroid spectra had been generally normalized near 1.215 μm, and we aim to be consistent with regard to asteroids. All Slope0.85−1.8 values were calculated by a linear fitting tool from the software OriginPro 2021. The principal component value PC4’ was also computed by the asteroids taxonomy online tool from the MIT web for asteroids and meteorites; PC4’ is used because it is useful for separating the C-type from the Ch- and Cgh-types (DeMeo et al. 2009), and Slope0.85−1.8 is used because it is useful for separating the B-type (generally have negative NIR slope) from the C-, Ch-, and Cgh-type (generally have positive NIR slope) (DeMeo et al. 2009).
Appendix D Asteroid information used in Fig. 8b
References
- Abe, M., Takagi, Y., Kitazato, K., et al. 2006, Science, 312, 1334 [Google Scholar]
- Adams, J. B., & McCord, T. B. 1970, Geochim. Cosmochim. Acta Suppl., 1, 1937 [NASA ADS] [Google Scholar]
- Allen, C., Morris, R., & McKay, D. 1996, in Lunar Planet. Sci. Conf., 27, 13 [Google Scholar]
- Applin, D. M., Izawa, M. R., Cloutis, E. A., et al. 2018, Icarus, 307, 40 [NASA ADS] [CrossRef] [Google Scholar]
- Arakawa, M., Saiki, T., Wada, K., et al. 2020, Science, 368, 67 [NASA ADS] [CrossRef] [Google Scholar]
- Basilevsky, A., Lorenz, C., Shingareva, T., et al. 2014, Planet. Space Sci., 102, 95 [CrossRef] [Google Scholar]
- Beck, P., Quirico, E., Montes-Hernandez, G., et al. 2010, Geochim. Cosmochim. Acta, 74, 4881 [NASA ADS] [CrossRef] [Google Scholar]
- Bell, J. F. 1988, Meteoritics, 23, 256 [NASA ADS] [Google Scholar]
- Binzel, R. P., Bus, S. J., Burbine, T. H., & Sunshine, J. M. 1996, Science, 273, 946 [NASA ADS] [CrossRef] [Google Scholar]
- Binzel, R., DeMeo, F., Turtelboom, E., et al. 2019, Icarus, 324, 41 [NASA ADS] [CrossRef] [Google Scholar]
- Bowell, E., Chapman, C. R., Gradie, J. C., Morrison, D., & Zellner, B. 1978, Icarus, 35, 313 [NASA ADS] [CrossRef] [Google Scholar]
- Braukmüller, N., Wombacher, F., Hezel, D. C., Escoube, R., & Münker, C. 2018, Geochim. Cosmochim. Acta, 239, 17 [Google Scholar]
- Britt, D., & Pieters, C. 1990, in Lunar Planet. Sci. Conf., 21, 127 [Google Scholar]
- Britt, D., & Pieters, C. 1994, Geochim. Cosmochim. Acta, 58, 3905 [NASA ADS] [CrossRef] [Google Scholar]
- Burbine, T., Binzel, R., Bus, S., & Clark, B. 2001, Meteor. Planet. Sci., 36, 245 [NASA ADS] [CrossRef] [Google Scholar]
- Bus, S. J., & Binzel, R. P. 2002, Icarus, 158, 146 [Google Scholar]
- Campagnola, S., Yam, C. H., Tsuda, Y., Ogawa, N., & Kawakatsu, Y. 2018, Acta Astronaut., 146, 409 [NASA ADS] [CrossRef] [Google Scholar]
- Chapman, C. R., & Salisbury, J. W. 1973, Icarus, 19, 507 [NASA ADS] [CrossRef] [Google Scholar]
- Chen-Lin, C., Baedecker, P. A., & Wasson, J. T. 1976, Geochim. Cosmochim. Acta, 40, 85 [NASA ADS] [CrossRef] [Google Scholar]
- Clark, R. N., & Roush, T. L. 1984, J. Geophys. Res.: Solid Earth, 89, 6329 [NASA ADS] [CrossRef] [Google Scholar]
- Clark, B. E., Fanale, F. P., & Salisbury, J. W. 1992, Icarus, 97, 288 [CrossRef] [Google Scholar]
- Clark, B. E., Lucey, P., Helfenstein, P., et al. 2001, Meteor. Planet. Sci., 36, 1617 [NASA ADS] [CrossRef] [Google Scholar]
- Clark, B. E., Bus, S. J., Rivkin, A. S., et al. 2004, J. Geophys. Res.: Planets, 109, E02001 [CrossRef] [Google Scholar]
- Clark, B. E., Ockert-Bell, M. E., Cloutis, E. A., et al. 2009, Icarus, 202, 119 [NASA ADS] [CrossRef] [Google Scholar]
- Clark, B. E., Binzel, R. P., Howell, E. S., et al. 2011, Icarus, 216, 462 [Google Scholar]
- Cloutis, E. A., Gaffey, M. J., Smith, D. G., & Lambert, R. S. J. 1990, J. Geophys. Res.: Solid Earth, 95, 8323 [NASA ADS] [CrossRef] [Google Scholar]
- Cloutis, E. A., Gaffey, M. J., & Moslow, T. F. 1994, Icarus, 107, 276 [NASA ADS] [CrossRef] [Google Scholar]
- Cloutis, E. A., Grasby, S. E., Last, W. M., et al. 2010, Planet. Space Sci., 58, 522 [CrossRef] [Google Scholar]
- Cloutis, E., Hiroi, T., Gaffey, M., Alexander, C. O., & Mann, P. 2011, Icarus, 212, 180 [NASA ADS] [CrossRef] [Google Scholar]
- Cloutis, E., Hudon, P., Hiroi, T., & Gaffey, M. 2012, Icarus, 220, 586 [NASA ADS] [CrossRef] [Google Scholar]
- Delbo, M., & Michel, P. 2011, ApJ, 728, L42 [NASA ADS] [CrossRef] [Google Scholar]
- DellaGiustina, D., Emery, J., Golish, D., et al. 2019, Nat. Astron., 3, 341 [CrossRef] [Google Scholar]
- DellaGiustina, D., Burke, K., Walsh, K., et al. 2020, Science, 370, eabc3660 [NASA ADS] [CrossRef] [Google Scholar]
- DeMeo, F. E., & Carry, B. 2014, Nature, 505, 629 [NASA ADS] [CrossRef] [Google Scholar]
- DeMeo, F. E., Binzel, R. P., Slivan, S. M., & Bus, S. J. 2009, Icarus, 202, 160 [Google Scholar]
- DeMeo, F. E., Binzel, R. P., & Lockhart, M. 2014, Icarus, 227, 112 [NASA ADS] [CrossRef] [Google Scholar]
- Fendrich, K. V., & Ebel, D. S. 2021, Meteor. Planet. Sci., 56, 77 [NASA ADS] [CrossRef] [Google Scholar]
- Fornasier, S., & Lazzarin, M. 2001, Icarus, 152, 127 [NASA ADS] [CrossRef] [Google Scholar]
- Fornasier, S., Migliorini, A., Dotto, E., & Barucci, M. 2008, Asteroids, Comets, Meteors 1405, 8045 [Google Scholar]
- Gaffey, M. J. 1976, J. Geophys. Res., 81, 905 [NASA ADS] [CrossRef] [Google Scholar]
- Gaffey, M. J., & Kelley, M. S. 2004, in Lunar Planet. Sci. Conf., 35, 1812 [Google Scholar]
- Gaffey, M. J., & McCord, T. B. 1978, Space Sci. Rev., 21, 555 [NASA ADS] [CrossRef] [Google Scholar]
- Gaffey, M. J., Reed, K. L., & Kelley, M. S. 1992, Icarus, 100, 95 [CrossRef] [Google Scholar]
- Gaffey, M. J., Bell, J. F., Brown, R. H., et al. 1993, Icarus, 106, 573 [NASA ADS] [CrossRef] [Google Scholar]
- Gattacceca, J., Bouvier, A., Grossman, J., Metzler, K., & Uehara, M. 2019, Meteor. Planet. Sci., 54, 469 [NASA ADS] [CrossRef] [Google Scholar]
- Gillis-Davis, J. J., Lucey, P. G., Bradley, J. P., et al. 2017, Icarus, 286, 1 [NASA ADS] [CrossRef] [Google Scholar]
- Gold, T. 1955, MNRAS, 115, 585 [NASA ADS] [CrossRef] [Google Scholar]
- Gold, T., Campbell, M., & O’leary, B. 1970, Science, 167, 707 [NASA ADS] [CrossRef] [Google Scholar]
- Gou, S., Yue, Z., Di, K., et al. 2020, Earth Planet. Sci. Lett., 535, 116117 [CrossRef] [Google Scholar]
- Gradie, J., & Tedesco, E. 1982, Science, 216, 1405 [NASA ADS] [CrossRef] [Google Scholar]
- Grün, E., Fechtig, H., Hanner, M., et al. 1991, in Origin and evolution of interplanetary dust (Springer), 21 [CrossRef] [Google Scholar]
- Hamilton, V., Simon, A., Christensen, P., et al. 2019, Nat. Astron., 3, 332 [CrossRef] [Google Scholar]
- Hapke, B. 1973, The Moon, 7, 342 [NASA ADS] [CrossRef] [Google Scholar]
- Hapke, B. 1981, J. Geophys. Res.: Solid Earth, 86, 3039 [NASA ADS] [CrossRef] [Google Scholar]
- Hapke, B. 1993, Theory of Reflectance and Emittance Spectroscopy (Cambridge University Press) [Google Scholar]
- Hapke, B. 2001, J. Geophys. Res.: Planets, 106, 10039 [NASA ADS] [CrossRef] [Google Scholar]
- Hapke, B., Cohen, A., Cassidy, W., & Wells, E. 1970, Geochim. Cosmochim. Acta Suppl., 1, 2199 [NASA ADS] [Google Scholar]
- Hapke, B., Cassidy, W., & Wells, E. 1975, The Moon, 13, 339 [NASA ADS] [CrossRef] [Google Scholar]
- Hiroi, T., Pieters, C. M., Zolensky, M. E., & Lipschutz, M. E. 1993, Science, 261, 1016 [NASA ADS] [CrossRef] [Google Scholar]
- Hiroi, T., Zolensky, E., & Lipschutz, E. 1994, Antarctic Meteorites XIX, 19, 194 [Google Scholar]
- Hiroi, T., Zolensky, M. E., & Pieters, C. M. 2001, Science, 293, 2234 [CrossRef] [Google Scholar]
- Hiroi, T., Abe, M., Kitazato, K., et al. 2006, Nature, 443, 56 [CrossRef] [Google Scholar]
- Hiroi, T., Sasaki, S., Misu, T., & Nakamura, T. 2013, in Lunar Planet. Sci. Conf., 1719, 1276 [Google Scholar]
- Jäger, C., Fabian, D., Schrempel, F., et al. 2003, A&A, 401, 57 [NASA ADS] [CrossRef] [EDP Sciences] [Google Scholar]
- Jin, Z., & Bose, M. 2019, Sci. Adv., 5, eaav8106 [CrossRef] [Google Scholar]
- Kaplan, H., Lauretta, D., Simon, A., et al. 2020, Science, 370, eabc3557 [NASA ADS] [CrossRef] [Google Scholar]
- Keil, K. 1989, Meteoritics, 24, 195 [NASA ADS] [CrossRef] [Google Scholar]
- Keil, K. 2010, Geochemistry, 70, 295 [NASA ADS] [CrossRef] [Google Scholar]
- Keller, L., & Clemett, S. J. 2001, in Lunar Planet. Sci. Conf., 32, 2097 [Google Scholar]
- Keller, L. P., & McKay, D. S. 1993, Science, 261, 1305 [NASA ADS] [CrossRef] [Google Scholar]
- Keller, L. P., & McKay, D. S. 1997, Geochim. Cosmochim. Acta, 61, 2331 [NASA ADS] [CrossRef] [Google Scholar]
- Keller, L. P., Wentworth, S. J., & McKay, D. S. 1997, in Lunar Planet. Sci. Conf., 28, 709 [Google Scholar]
- Keller, L. P., Wentworth, S. J., & McKay, D. S. 1998, in Lunar Planet. Sci. Conf., 29, 1762 [Google Scholar]
- Keller, L., Rahman, Z., Hiroi, T., et al. 2013, in Lunar Planet. Sci. Conf., 44, 2404 [Google Scholar]
- King, A. J., Schofield, P. F., & Russell, S. S. 2021, Geochim. Cosmochim. Acta, 298, 167 [NASA ADS] [CrossRef] [Google Scholar]
- Kitazato, K., Milliken, R., Iwata, T., et al. 2019, Science, 364, 272 [NASA ADS] [Google Scholar]
- Kitazato, K., Milliken, R., Iwata, T., et al. 2021, Nat. Astron., 5, 246 [NASA ADS] [CrossRef] [Google Scholar]
- Lai, H., Wang, S., & Yu, N. 2003, Acta Mineral. Sinica, 23, 124 [Google Scholar]
- Lantz, C., Brunetto, R., Barucci, M., et al. 2015, A&A, 577, A41 [NASA ADS] [CrossRef] [EDP Sciences] [Google Scholar]
- Lantz, C., Brunetto, R., Barucci, M., et al. 2017, Icarus, 285, 43 [CrossRef] [Google Scholar]
- Lantz, C., Binzel, R., & DeMeo, F. 2018, Icarus, 302, 10 [CrossRef] [Google Scholar]
- Lauretta, D., Balram-Knutson, S., Beshore, E., et al. 2017, Space Sci. Rev., 212, 925 [CrossRef] [Google Scholar]
- Lauretta, D., DellaGiustina, D., Bennett, C., et al. 2019, Nature, 568, 55 [NASA ADS] [CrossRef] [Google Scholar]
- Levison, H., et al. 2016, in Lunar Planet. Sci. Conf., 1903, 2061 [Google Scholar]
- Lindgren, P., Lee, M. R., Sparkes, R., et al. 2020, Geochim. Cosmochim. Acta, 289, 69 [Google Scholar]
- Lucey, P. G., & Noble, S. K. 2008, Icarus, 197, 348 [NASA ADS] [CrossRef] [Google Scholar]
- Lucey, P. G., Blewett, D. T., Taylor, G. J., & Hawke, B. R. 2000, J. Geophys. Res.: Planets, 105, 20377 [NASA ADS] [CrossRef] [Google Scholar]
- Lucey, P. G., Greenhagen, B. T., Song, E., et al. 2017, Icarus, 283, 343 [CrossRef] [Google Scholar]
- Matsumoto, T., Tsuchiyama, A., Miyake, A., et al. 2015, Icarus, 257, 230 [CrossRef] [Google Scholar]
- Matsuoka, M., Nakamura, T., Kimura, Y., et al. 2015, Icarus, 254, 135 [NASA ADS] [CrossRef] [Google Scholar]
- Matsuoka, M., Nakamura, T., Hiroi, T., Okumura, S., & Sasaki, S. 2020, ApJ, 890, L23 [CrossRef] [Google Scholar]
- McFadden, L. A., Gaffey, M. J., & McCord, T. B. 1985, Science, 229, 160 [NASA ADS] [CrossRef] [Google Scholar]
- McKay, D. S., Heiken, G., Basu, A., et al. 1991, Lunar Sourcebook, 567, 285 [Google Scholar]
- Michel, P., & Delbo, M. 2010, Icarus, 209, 520 [NASA ADS] [CrossRef] [Google Scholar]
- Morota, T., Sugita, S., Cho, Y., et al. 2020, Science, 368, 654 [NASA ADS] [CrossRef] [Google Scholar]
- Moroz, L., Baratta, G., Strazzulla, G., et al. 2004, Icarus, 170, 214 [CrossRef] [Google Scholar]
- Nakamura, T., Noguchi, T., Tanaka, M., et al. 2011, Science, 333, 1113 [NASA ADS] [CrossRef] [Google Scholar]
- Nedelcu, D. A., Birlan, M., Vernazza, P., et al. 2007, A&A, 473, L33 [NASA ADS] [CrossRef] [EDP Sciences] [Google Scholar]
- Noble, S. K., Pieters, C. M., & Keller, L. P. 2007, Icarus, 192, 629 [CrossRef] [Google Scholar]
- Noble, S., Hiroi, T., Keller, L., & Pieters, C. 2011, in Lunar Planet. Sci. Conf., 42, 1382 [Google Scholar]
- Noguchi, T., Nakamura, T., Kimura, M., et al. 2011, Science, 333, 1121 [NASA ADS] [CrossRef] [Google Scholar]
- Noguchi, T., Kimura, M., Hashimoto, T., et al. 2014, Meteor. Planet. Sci., 49, 188 [CrossRef] [Google Scholar]
- Okazaki, M., Sasaki, S., Tsuchiyama, A., et al. 2015, in Lunar Planet. Sci. Conf., 1832, 1890 [Google Scholar]
- Perna, D., Barucci, M., Ishiguro, M., et al. 2017, A&A, 599, L1 [NASA ADS] [CrossRef] [EDP Sciences] [Google Scholar]
- Pieters, C. M., & Noble, S. K. 2016, J. Geophys. Res.: Planets, 121, 1865 [NASA ADS] [CrossRef] [Google Scholar]
- Pieters, C. M., Murchie, S., Thomas, N., & Britt, D. 2014, Planet. Space Sci., 102, 144 [CrossRef] [Google Scholar]
- Pizzarello, S., Huang, Y., Becker, L., et al. 2001, Science, 293, 2236 [CrossRef] [Google Scholar]
- Reddy, V., Pearson, N., Agee, C., et al. 2019, in Lunar Planet. Sci. Conf., 2132, 2212 [Google Scholar]
- Rubin, A. E., & Keil, K. 1983, Earth Planet. Sci. Lett., 62, 118 [CrossRef] [Google Scholar]
- Sasaki, S., Nakamura, K., Hamabe, Y., Kurahashi, E., & Hiroi, T. 2001, Nature, 410, 555 [NASA ADS] [CrossRef] [Google Scholar]
- Shepard, M. K., Clark, B. E., Nolan, M. C., et al. 2008, Icarus, 193, 20 [NASA ADS] [CrossRef] [Google Scholar]
- Shepard, M. K., Clark, B. E., Ockert-Bell, M., et al. 2010, Icarus, 208, 221 [NASA ADS] [CrossRef] [Google Scholar]
- Simon, S. B., & Haggerty, S. E. 1979, in Lunar Planet. Sci. Conf., 10, 871 [Google Scholar]
- Simon,A. A., Kaplan, H. H., Hamilton, V. E., et al. 2020, Science, 370, eabc3522 [NASA ADS] [CrossRef] [Google Scholar]
- Sugita, S., Honda, R., Morota, T., et al. 2019, Science, 364, eaaw0422 [Google Scholar]
- Tai, K., Guo, Z., Li, Y., et al. 2021, Acta Geol. Sinica, 95, 2857 [Google Scholar]
- Takigawa, A., Asada, Y., Nakauchi, Y., et al. 2019, in 82nd Annual Meeting of The Meteoritical Society [Google Scholar]
- Tao, K., Wen, C., & Gui, W. 1979, Chinese J. Geol., 14, 270 [Google Scholar]
- Tatsumi, E., Domingue, D., Schröder, S., et al. 2020, A&A, 639, A83 [NASA ADS] [CrossRef] [EDP Sciences] [Google Scholar]
- Tatsumi, E., Sugimoto, C., Riu, L., et al. 2021, Nat. Astron., 5, 39 [NASA ADS] [CrossRef] [Google Scholar]
- Tholen, D. J. 1984, PhD thesis, The University of Arizona, USA [Google Scholar]
- Thomas, C. A., Rivkin, A. S., Trilling, D. E., Enga, M.-t., & Grier, J. A. 2011, Icarus, 212, 158 [NASA ADS] [CrossRef] [Google Scholar]
- Thompson, M., Loeffler, M., Morris, R., Keller, L., & Christoffersen, R. 2019, Icarus, 319, 499 [CrossRef] [Google Scholar]
- Thompson, M., Morris, R., Clemett, S., et al. 2020, Icarus, 346, 113775 [CrossRef] [Google Scholar]
- Trang, D., & Lucey, P. G. 2019, Icarus, 321, 307 [CrossRef] [Google Scholar]
- Tsuda, Y., Yoshikawa, M., Abe, M., Minamino, H., & Nakazawa, S. 2013, Acta Astronaut., 91, 356 [NASA ADS] [CrossRef] [Google Scholar]
- Vernazza, P., Brunetto, R., Binzel, R., et al. 2009, Icarus, 202, 477 [NASA ADS] [CrossRef] [Google Scholar]
- Vernazza, P., Marsset, M., Beck, P., et al. 2016, AJ, 152, 54 [CrossRef] [Google Scholar]
- Walsh, K., Jawin, E., Ballouz, R.-L., et al. 2019, Nat. Geosci., 12, 242 [NASA ADS] [CrossRef] [Google Scholar]
- Watters, T. R., & Prinz, M. 1979, in Lunar Planet. Sci. Conf., 10, 1073 [NASA ADS] [Google Scholar]
- Watters, T., Prinz, M., Rambaldi, E., & Wasson, J. 1980, Meteoritics, 15, 386 [NASA ADS] [Google Scholar]
- Weber, I., Stojic, A. N., Morlok, A., et al. 2020, Earth Planet. Sci. Lett., 530, 115884 [CrossRef] [Google Scholar]
- Wu, Y., Li, X., Yao, W., & Wang, S. 2017, J. Geophys. Res.: Planets, 122, 1956 [NASA ADS] [CrossRef] [Google Scholar]
- Zellner, B., Leake, M., Morrison, D., & Williams, J. 1977, Geochim. Cosmochim. Acta, 41, 1759 [NASA ADS] [CrossRef] [Google Scholar]
- Zhang, P., Li, Y., Li, S., et al. 2020, in Lunar Planet. Sci. Conf., 2326, 2068 [Google Scholar]
All Tables
Spectral parameters of 8 meteorites used in this study before and after irradiation.
Iron content in main silicate crystals and water content in bulk rock of partial meteorites used in this study
All Figures
|
Fig. 1 Reflectance spectra without (a–e) and with (f–j) normalization at 0.55 μm of virgin and irradiated meteorites. All solid lines are virgin spectra and dashed lines are irradiated spectra. |
| In the text | |
|
Fig. 2 Micro-characteristics of laser irradiated CV3 Allende: (a) SEM secondary electron image of irradiated (left of dotted line) and unirradiated area (right of dotted line); (b) TEM bright field image of FIB section sampled from the box position in (a); (c) TEM high resolution image of npFe0 marked by the box in (b). The interplanar spacing is d = 0.203 nm, consistent with spacing of a crystal lattice plane (110) of α-Fe. |
| In the text | |
|
Fig. 3 Micro-characteristics of laser irradiated CO3 Shanshan 002: (a) TEM bright field image of the FIB section sampled from irradiated area; (b) TEM HAADF (high-angle annular dark-field) image of the box region in (a); (c–g) TEM EDS mapping in different elements of the box region in (b); (h) a zoomed-in view of the region marked in (a). |
| In the text | |
|
Fig. 4 Micro-characteristics of laser irradiated aubrite Norton County: (a) SEM secondary electron image of laser irradiated area. An irradiated crater with about 1 mm diameter can be recognized; (b) the zoomed-in secondary electron image of the box region in (a). The molten surface is rough and porous; (c) TEM bright field image of FIB section sampled from the box position in (b). |
| In the text | |
|
Fig. 5 Micro-characteristics of laser irradiated EH4 Abee (a, b) and Indarch (c, d): (a) SEM secondary electron image of unirradiated (top right) and irradiated (left) area. The un-En means unirradiated enstatite; (b) SEM backscattered electron image of irradiated area; (c) SEM secondary electron image of irradiated area; (d) SEM backscattered electron image of irradiated area. |
| In the text | |
|
Fig. 6 Micro-characteristics of laser irradiated CM2 Murchison: (a) SEM secondary electron image of unirradiated (top right) and irradiated (bottom left) area; (b) SEM secondary electron image of molten crater and fragments produced by laser in the irradiated area; (c) SEM secondary electron image of the irradiated area; (d) the zoomed-in SEM secondary electron image of the box region in (b); (e) the zoomed-in SEM secondary electron image of the irradiated area; (f) TEM bright field image of FIB section sampled from the box position in (e). No nanophase particle but abundant bubbles are seen, and the bubbles tend to increase in size from subsurface to surface, indicating that a lot of volatiles (likely to be mainly water produced by dehydration of phyllosilicates) were released during the irradiated process. |
| In the text | |
|
Fig. 7 Multistage SWSAE model of Murchison given by heating and laser irradiating experiments. (a) SWSAE of Murchison revealed by R0.55 (absolute reflectance at 0.55 μm) changes and near-infrared slope R1.8/R0.75 (ratio of absolute reflectance at 1.8 μm to that at 0.75 μm) changes. It suggests that SWSAE is not simply reddening or bluing but related to the SW degree: as the SW degree becomes stronger, first it darkens and becomes bluer then brightens and continues to become bluer. Small black symbols represent heated data come from Hiroi et al. (1993). Large symbols represent laser irradiated data, where solid symbols represent unirradiated and open symbols are irradiated. The purple symbols represent data obtained in this study; the other irradiated data related to Murchison (size <63 μm) come from Matsuoka et al. (2015, 2020); (b) SWSAE of Murchison on the ultraviolet and visible region. It suggests that as the SW degree becomes stronger, Murchison brightens initially in the ultraviolet region (0.35 μm band), and then in the visible region (0.45 μm band). The vertical axis (ΔR0.35) represents the value of reflectance at 0.35 μm of heated or irradiated minus unheated or unirradiated sample, and the horizontal axis (ΔR0.45) represents the value of reflectance at 0.45 μm of heated orirradiated subtract unheated/unirradiated sample. The red shot-dotted line (Trend line) is a suppositional evolution path for the irradiated Murchison from stage III (first quadrant) to stage IV (second quadrant). |
| In the text | |
|
Fig. 8 Potential transformation trends of asteroidal spectral types driven by SW: (a) transformation trends of asteroidal spectral types on the S-complex. Unirradiated H6 and LL5/6 ordinary chondrites (large solid symbols) are the best match for Q-types, while after irradiation, they tend to move toward Sq- and S-types, indicating an evolution trend of “Q-Sq-S” driven by SW. The line α was definedin DeMeo et al. (2009) and used to separate S-complex from other types. The vertical axis PC1’ (first principal component) and horizontal axis PC2’ (second principal component) are also calculated based on DeMeo et al. (2009). For background on our choice to use PC1’ and PC2’ here, we refer to Appendix C. All of the near-Earth objects (NEOs) data come from Binzel et al. (2019); (b) Transformation trends of asteroidal spectral types on carbonaceous composition. The unheated and unirradiated Murchison are close to the Ch and Cgh-type area, and as heated temperature and irradiated energy increases, they generally move toward the B-type and ultimately fall into the B-type range, revealing that a Ch or Cgh-type could become a B-type due to SW. The vertical axis Slope0.85−1.8 is the linear fitting slope within 0.85–1.8 μm region, and the values of horizontal axis PC4’ (fourth principal component) are calculated on the basis of DeMeo et al. (2009). For the reason we use Slope0.85−1.8 and PC4’ here, please see Appendix C. For data on the asteroids used here, we refer to Table D.1. |
| In the text | |
Current usage metrics show cumulative count of Article Views (full-text article views including HTML views, PDF and ePub downloads, according to the available data) and Abstracts Views on Vision4Press platform.
Data correspond to usage on the plateform after 2015. The current usage metrics is available 48-96 hours after online publication and is updated daily on week days.
Initial download of the metrics may take a while.