Fig. 7
Download original image
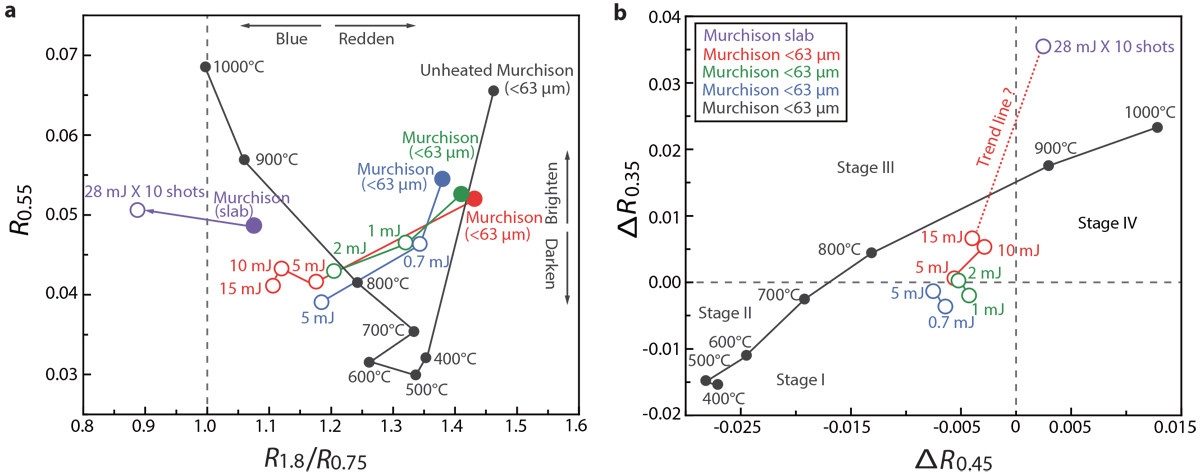
Multistage SWSAE model of Murchison given by heating and laser irradiating experiments. (a) SWSAE of Murchison revealed by R0.55 (absolute reflectance at 0.55 μm) changes and near-infrared slope R1.8/R0.75 (ratio of absolute reflectance at 1.8 μm to that at 0.75 μm) changes. It suggests that SWSAE is not simply reddening or bluing but related to the SW degree: as the SW degree becomes stronger, first it darkens and becomes bluer then brightens and continues to become bluer. Small black symbols represent heated data come from Hiroi et al. (1993). Large symbols represent laser irradiated data, where solid symbols represent unirradiated and open symbols are irradiated. The purple symbols represent data obtained in this study; the other irradiated data related to Murchison (size <63 μm) come from Matsuoka et al. (2015, 2020); (b) SWSAE of Murchison on the ultraviolet and visible region. It suggests that as the SW degree becomes stronger, Murchison brightens initially in the ultraviolet region (0.35 μm band), and then in the visible region (0.45 μm band). The vertical axis (ΔR0.35) represents the value of reflectance at 0.35 μm of heated or irradiated minus unheated or unirradiated sample, and the horizontal axis (ΔR0.45) represents the value of reflectance at 0.45 μm of heated orirradiated subtract unheated/unirradiated sample. The red shot-dotted line (Trend line) is a suppositional evolution path for the irradiated Murchison from stage III (first quadrant) to stage IV (second quadrant).
Current usage metrics show cumulative count of Article Views (full-text article views including HTML views, PDF and ePub downloads, according to the available data) and Abstracts Views on Vision4Press platform.
Data correspond to usage on the plateform after 2015. The current usage metrics is available 48-96 hours after online publication and is updated daily on week days.
Initial download of the metrics may take a while.