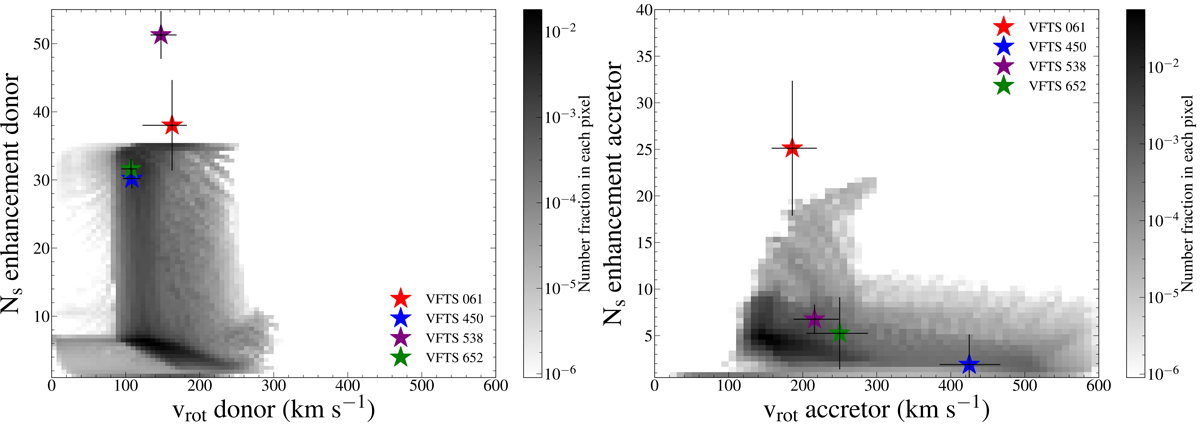
Fig. 8.
Download original image
Probability distribution of the surface nitrogen mass fraction enhancement vs rotational velocity of the donor (left panel) and accretor (right panel) during the semi-detached phase. The different coloured stars with error bars denote the position of the semi-detached systems of the TMBM survey (Table 3). Grey-scale: see description in Fig. 7.
Current usage metrics show cumulative count of Article Views (full-text article views including HTML views, PDF and ePub downloads, according to the available data) and Abstracts Views on Vision4Press platform.
Data correspond to usage on the plateform after 2015. The current usage metrics is available 48-96 hours after online publication and is updated daily on week days.
Initial download of the metrics may take a while.