| Issue |
A&A
Volume 659, March 2022
|
|
|---|---|---|
| Article Number | A65 | |
| Number of page(s) | 8 | |
| Section | Interstellar and circumstellar matter | |
| DOI | https://doi.org/10.1051/0004-6361/202142414 | |
| Published online | 08 March 2022 | |
Methoxymethanol formation starting from CO hydrogenation
1
Laboratory for Astrophysics, Leiden Observatory, Leiden University,
PO Box 9513,
2300
RA Leiden,
The Netherlands
2
Max Planck Institute for Astronomy,
Königstuhl 17,
69117
Heidelberg,
Germany
e-mail: This email address is being protected from spambots. You need JavaScript enabled to view it.
3
Institute for Molecules and Materials, Radboud University Nijmegen,
Heyendaalseweg 135,
6525
AJ Nijmegen,
The Netherlands
4
Research Laboratory for Astrochemistry, Ural Federal University,
Kuibysheva St. 48,
620026
Ekaterinburg,
Russia
5
Laboratory Astrophysics Group of the Max Planck Institute for Astronomy at the Friedrich Schiller University Jena, Institute of Solid State Physics,
Helmholtzweg 3,
07743
Jena,
Germany
6
Current address: Astrochemistry Laboratory, NASA Goddard Space Flight Center,
Greenbelt,
MD
20771,
USA
7
Leiden Institute of Chemistry, Gorlaeus Laboratories, Leiden University,
PO Box 9502,
2300
RA Leiden,
The Netherlands
8
School of Electronic Engineering and Computer Science, Queen Mary University of London,
Mile End Road,
London
E1 4NS,
UK
9
Department of Chemistry, Massachusetts Institute of Technology,
Cambridge,
MA
02139,
USA
10
National Radio Astronomy Observatory,
Charlottesville,
VA
22903,
USA
11
Harvard-Smithsonian Center for Astrophysics,
Cambridge,
MA
02138,
USA
Received:
11
October
2021
Accepted:
11
December
2021
Abstract
Context. Methoxymethanol (CH3OCH2OH) has been identified through gas-phase signatures in both high- and low-mass star-forming regions. Like several other C-, O-, and H-containing complex organic molecules (COMs), this molecule is expected to form upon hydrogen addition and abstraction reactions in CO-rich ice through radical recombination of CO hydrogenation products.
Aims. The goal of this work is to experimentally and theoretically investigate the most likely solid-state methoxymethanol reaction channel – the recombination of CH2OH and CH3O radicals – for dark interstellar cloud conditions and to compare the formation efficiency with that of other species that were shown to form along the CO-hydrogenation line. We also investigate an alternative hydrogenation channel starting from methyl formate.
Methods. Hydrogen atoms and CO or H2CO molecules were co-deposited on top of predeposited H2O ice to mimic the conditions associated with the beginning of “rapid” CO freeze-out. The formation of simple species was monitored in situ using infrared spectroscopy. Quadrupole mass spectrometry was used to analyze the gas-phase COM composition following a temperature-programmed desorption. Monte Carlo simulations were used for an astrochemical model comparing the methoxymethanol formation efficiency with that of other COMs.
Results. The laboratory identification of methoxymethanol is found to be challenging, in part because of diagnostic limitations, but possibly also because of low formation efficiencies. Nevertheless, unambiguous detection of newly formed methoxymethanol has been possible in both CO+H and H2CO+H experiments. The resulting abundance of methoxymethanol with respect to CH3OH is about 0.05, which is about six times lower than the value observed toward NGC 6334I and about three times lower than the value reported for IRAS 16293B. Astrochemical simulations predict a similar value for the methoxymethanol abundance with respect to CH3OH, with values ranging between 0.03 and 0.06.
Conclusions. We find that methoxymethanol is formed by co-deposition of CO and H2CO with H atoms through the recombination of CH2OH and CH3O radicals. In both the experimental and modeling studies, it is found that the efficiency of this channel alone is not sufficient to explain the observed abundance of methoxymethanol with respect to methanol. The rate of a proposed alternative channel, the direct hydrogenation of methyl formate, is found to be even less efficient. These results suggest that our knowledge of the reaction network is incomplete or involving alternative solid-state or gas-phase formation mechanisms.
Key words: astrochemistry / molecular processes / solid state: volatile / ISM: molecules
© J. He et al. 2022
 Open Access article, published by EDP Sciences, under the terms of the Creative Commons Attribution License (https://creativecommons.org/licenses/by/4.0), which permits unrestricted use, distribution, and reproduction in any medium, provided the original work is properly cited.
Open Access funding provided by Max Planck Society.
1 Introduction
Ices covering cold dust grains in prestellar cores typically comprise two chemically different layers; a bottom layer dominated by H2O and CO2 (also comprising NH3 and CH4), and a top layer dominated by CO (Pontoppidan et al. 2008; Boogert et al. 2015). This two-layer structure reflects different evolutionary phases along the process of star formation; the water-rich phase is dominated by atom-addition reactions (O + H, N + H, C + H) and accretion of less volatile species, whereas the formation of the top layer is mainly driven by CO accretion from the gas phase (Herbst & van Dishoeck 2009; Linnartz et al. 2015; Öberg 2016). In a number of recent studies, this rapid accretion of CO molecules was shown to act as a starting point leading to the formation of larger, typically C-, O-, N-, and H-containing species. In cold and dark environments, such as prestellar cores, the majority of the chemical processes take place through “dark chemistry”, that is, chemistry driven by atom-addition reactions between accreting species reaching thermal equilibrium with the icy grain surface. This is the topic of the present work. In a series of earlier dedicated laboratory studies, it was shown that CO hydrogenation leads to H2CO and CH3OH formation (Watanabe & Kouchi 2002; Fuchs et al. 2009). Addition and abstraction reactions result in the formation of radical intermediates (HCO, CH3O, and CH2OH) that can recombine with each other or interact with larger (stable) species already present in the ice to form even more complex species. In this way, it was shown that ongoing hydrogenations, and radical-radical and radical-molecule recombinations can explain the astronomical formation of glycolaldehyde (GA; CH2OHCHO), ethylene glycol (EG; (CH2OH)2), and to some extent glyoxal (GX; (HCO)2) and methyl formate (MF; CH3OCHO) (Fedoseev et al. 2015; Chuang et al. 2016, 2017; Butscher et al. 2017, 2019). This is shown in Fig. 1 adapted from Chuang et al. (2016) with a modification (in red) to show the methoxymethanol (MM; CH3OCH2OH) formation route under study in this work (in the figure the formulae are written following the actual molecular geometry). Subsequent laboratory studies showed that following the same principle of consecutive hydrogenation and recombination reactions, larger species, such as glycerol, can be formed (Fedoseev et al. 2017). Ultimately, this would provide a pathway toward ribose, a compound of direct biological relevance. Several studies have been published in the last decade focusing on solid-state MM formation pathways through energetic processing of CH3OH ice or CH3OH-containing ices (Maity et al. 2015; Paardekooper et al. 2016; Schneider et al. 2019; Inostroza-Pino et al. 2020). These studies demonstrate that it is possible to form MM under UV light photolysis or upon cosmic-ray bombardment. The ionizing irradiation by UV or cosmic rays is less typical in the prestellar phase in which “nonenergetic” atom addition reactions between thermalized species are most relevant, but may take over at later stages in the star formation process. However, the involved reactive intermediates are largely similar.
Even though these complex organic molecules (COMs) are expected to form on icy grains, solid-state identifications have not yet been realized in interstellar clouds. Currently, worldwide efforts are underway to collect spectra for laboratory COMs in ice in support of JWST observing programs set to generate detailed ice maps of the interstellar medium (ISM; see e.g., Terwisscha van Scheltinga et al. 2018; Hudson & Gerakines 2019). It is generally assumed that frozen COMs are liberated from icy dust grains through (non)thermal processes, such as during the warm-up of a cloud (Garrod 2013) or due to shock impacts (Requena-Torres et al. 2006; Lee et al. 2017). In the gas phase, COMs are typically detected using radio and submillimeter telescopes (see e.g., Jørgensen et al. 2012; Belloche et al. 2013; McGuire 2018, and references therein). Recently, methoxymethanol was identified in the gas phase; using ALMA, MM was abundantly detected toward the MM1 core in the high-mass star-forming region NGC 6334I (McGuire et al. 2017) at a 34 times lower abundance than CH3OH, and toward a low-mass star-forming region IRAS 16293-2422 B (Manigand et al. 2020).
The formation of MM through recombination of CH3O and CH2OH radicals, which are formed by surface CO hydrogenation by accreting H atoms in a typical prestellar setting, has not previously been studied experimentally. The presence of both radicals is expected, as MF, GA, and EG were shown to form through reactions involving these radicals (Chuang et al. 2017). The CH3O and CH2OH radicals can be formed upon H2CO hydrogenation (which is formed by CO hydrogenation) or upon H-atom abstraction from CH3OH. After water, CO is one of the most abundant ice constituents on cold dust grains. H2CO ice has also been tentatively identified toward young stellar objects at the 2%–7% level with respect to H2O ice (Keane et al. 2001; Boogert et al. 2015). CH3OH is the largest COM that has been unambiguously identified in solid state on dust grains (Boogert et al. 2015, and references therein).
In addition to observational and experimental attempts, the results of modeling studies have been reported in the literature. A three-phase chemical kinetics code magikal, first introduced in Garrod (2013), was used to model the formation of MM, but resulted in an unexpected MM:CH3OH ratio of 10−7, which is far from the observationally derived value. McGuire et al. (2017) attributed this difference to incomplete reaction networks and unconstrained reaction efficiencies and barriers. New experimental and theoretical studies, as presented here, provide additional information.
In the following section, we first describe the performed experiments and their analysis, followed by the experimental results and their interpretations. The description of the experimental work is followed by the numerical simulations utilizing the Kinetic Monto Carlo code presented in Simons et al. (2020). First, the experimental results are reproduced by the model. The same parameter space is then used to extrapolate these to astronomical timescales. The resulting CH3OH:MM ratios are compared with those observed in the ISM (McGuire et al. 2017; Manigand et al. 2020). This work is concluded with a discussion of the differences between the obtained experimental and theoretical findings and values derived from observations.
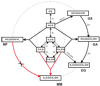 |
Fig. 1 Extended COM formation network as obtained from the CO, H2CO, and CH3OH hydrogenation experiments. Solid arrows indicate the reaction pathways confirmed or suggested in this study. Dashed arrows indicate the pathways that are generally less efficient. This figure is updated from Fig. 8 in Chuang et al. (2016). New additions based on this work are shown in red. |
2 Methods
2.1 Laboratory experiments
Experiments are performed using the SURFRESIDE3 apparatus, which is described in detail in Ioppolo et al. (2013). Recent updates are available from Qasim et al. (2020). SURFRESIDE3 is an ultra-high vacuum (UHV) setup with a base pressure of ~10−10 mbar. Ices are grown on a 2.5 cm × 2.5 cm gold-plated surface that is located at the center of the main reaction chamber. A closed-cycle helium cryostat cools the gold substrate to as low as 8 K. The substrate temperature is monitored using a silicon diode temperature sensor installed at the back of the substrate. A cartridge heater located above the sample can be used to heat the substrate to as high as 450 K. A sapphire thermal switch between the substrate and the cold head of the cryostat enables heating the substrate to a high temperature without warming up the whole cold head and the surrounding radiation shield. A Lakeshore 340 temperature controller reads and controls the temperature to an accuracy of 0.5 K. Ices on the gold substrate can be monitored both by reflection absorption infrared spectroscopy (RAIRS) and by temperature programmed desorption (TPD) using a quadrupole mass spectrometer (QMS). RAIRS is an in situ diagnostic tool that allows the monitoring of ice changes in real time and without the need for ice heating to realize mass spectrometric detection; however, it suffers from the fact that infrared (IR) absorption features of COMs often overlap significantly with each other – because of similar functional groups – and with the absorption features of other smaller and more abundant species. TPD-QMS is more sensitive – thermally desorbed species are ionized by an electron source and detected in the gas phase – but ice destruction is intrinsic to its application. Upon ionization, COMs fragment and show molecule-specific mass spectra (fragmentation patterns). This provides a further diagnostic tool, in particular when also using isotopically enriched precursors. In this study, we used RAIRS mainly to quantify the amount of CO, formaldehyde (H2CO), or MF deposited on the substrate. For this, an FTIR spectrometer is used that covers the 4000–700 cm−1 region with a spectral resolution of roughly 1 cm−1. Given the rather low abundances of the formed molecules and the spectral overlaps with other species present in the ice, RAIRS was not suited to unambiguously prove MM formation. To identify the molecules that are formed in the ice upon atom bombardment, the ice is heated at a rate of 5 K min−1 and TPD-QMS is performed.
The ice samples are grown through co-deposition of molecules and atoms on the precooled substrate. CO gas (Linde, 99.997%) and H2CO vapors or their 13CO (Sigma-Aldrich, 99 atom % 13C), C18 O isotopologs (Sigma-Aldrich, 95 atom% 18O), or  isotopologs are admitted into the chamber from a pre-pumped dosing line via a variable leak valve. H2CO or
  vapors are prepared in a hot water bath of paraformaldehyde (Sigma-Aldrich, 95%) or 13C-paraformaldehyde (Sigma-Aldrich, 99 atom% 13C) powder, respectively. MF (Sigma-Aldrich, 99%) and H2O (Milli-Q) vapors are evaporated from their liquid form several freeze-pump-thaw cycles. H2O is admitted to the chamber via a separate UHV unit that is connected to the main reaction chamber via a shutter, while MF is admitted through another variable all-metal leak valve. The amount of CO, H2CO, and formed CH3OH on the substrate is measured in situ from the IR absorption band area using setup-specific band strengths reported in Chuang et al. (2018). For MF, this value is unavailable and is estimated by assuming that the band-strength ratio of MF between reflection and transmission modes is similar to that of H2CO. The transmission band strength of MF from Modica & Palumbo (2010) (4.87 × 10⁻¹⁷ cm molecule−1, the average values on Si and KBr substrate) is used to extrapolate the MF RAIRS band strength. Hydrogen atoms are produced by a commercially available microwave atom source (MWAS) with a flux of (2–4) × 1012 atoms cm−2 s−1. The calibration method used to estimate the atomic hydrogen flux is reported in Ioppolo et al. (2013). Relative COMs formation yields are quantified by analyzing the TPD mass peaks. The mass-to-charge values used for CH3OH, MM, GA, and EG are 32, 61, 60, and 33, respectively, while ionization cross-sections are equal to 4.44, 7.16, 6.5, and 7.16 Å2, which are the same values used in Chuang et al. (2017). Quantitative analysis of MM is significantly complicated by the lack of literature data for this molecule given its spontaneous decomposition under standard conditions. To the best of our knowledge, no literature values are available for the ionization cross-section of MM. Therefore, the value available for EG is adapted for MM because of the structural similarity between the two molecules. The only available full-range mass-spectrum is taken from Johnson & Stanley (1991). This spectrum reveals a significantly higher fraction of heavy m/z = 61 signal with respect to the lower m/z values in comparison to the well-known spectra of GA and EG. Under our experimental conditions, this may result in the systematic underestimation of the amounts of the formed MM. This is important to note, as below we report findings that suggest higher MM abundances. The obtained abundances can be reevaluated if better data become available. The aforementioned spontaneous decomposition of MM on the walls of the setup and the QMS is another factor reducing the observed amounts of MM.
Table 1 lists the relevant experiments performed in this study. For each of them, the gold substrate is pre-covered by five monolayers (ML, 1015 molecules cm−2) of amorphous solid water (ASW) to emulate the water-rich layer on dust grains. The water ice is grown by water vapor deposition when the substrate is at 10 K. It is well-known that ASW grown under this condition is highly porous, offering a large surface area (Stevenson et al. 1999; He et al. 2019).
2.2 Kinetic Monte Carlo simulations
Ice evolution was simulated using a KMC algorithm similar to Cuppen & Herbst (2007); Cuppen et al. (2009). A similar setup and network are used to those of Simons et al. (2020). A detailed description of this technique can be found in Cuppen et al. (2013). The grain surface is described by a 100 × 100 grid of binding sites with periodic boundaries. A random number generator is used to determine the sequence of events from predefined rates for all relevant processes. These processes include deposition of species, hopping between sites on the grid, the reaction between two surface species, and desorption from the surface. This KMC method is used to simulate both experimental and interstellar conditions. Experimental conditions are set to reflect experiments 3 and 5 from Table 1. The CO flux was adjusted to deposit a total of 2.65 ML during the simulation while hydrogen flux is then set to 3 × 1012 cm−2 s−1 to be in line with the experiments. For interstellar conditions, simulations with n(H) = 2.5 and 4.0 cm−3 at temperatures of 10 and 12 K are performed. The initial CO gas-phase abundance is set at 10 cm−3 for all simulations, and the CO flux is constantly recalculated, taking into account the CO depletion of the gas by CO freeze-out. The reaction network used is similar to that of Simons et al. (2020) with the addition of the proposed formation of methoxymethanol: CH3O + CH2OH → CH3OCH2OH. This reaction competes with CH3O + CH2OH → CH3OH + H2CO. This latter reaction was studied by Simons et al. (2020) and is currently also the topic of ongoing experimental work. These reactions are barrierless and their relative reaction efficiencies is determined to be 0.25:0.65, respectively, with a 0.10 nonreactive branch. This is similar to what is described in Lamberts (2018). Furthermore, the rate of the reaction CH3OH + H → CH2OH + H2 was updated to 7.22 × 10³ s−1 following Cooper & Kästner (2019).
Experiments performed in this study.
3 Results and analysis
3.1 Methoxymethanol formation through CO and H2CO hydrogenation
Figure 2 shows the TPD spectra during a temperature ramp of 5 K min−1 after a H2CO and H-atom co-deposition experiment at 10 K (Exp. 5). The spectra show clear evidence for the presence of an initial H2CO precursor and its hydrogenation product, CH3OH, peaking at temperatures of 95 (m∕z = 29, 30) and 139 K (m∕z = 29–33), respectively. The figure also shows that larger COMs are formed, such as GA and EG, that can beunambiguously detected at 156 and 195 K by their molecular mass signals (m∕z = 60 for GA, and m∕z = 624 for EG) and shared mass fragments (m∕z = 29, 30, 31, 32, and 33) (Chuang et al. 2016). As the formation of these two-carbon COMs involves the same radicals (CH3O and CH2OH) needed to form methoxymethanol, it makes sense to search for MM mass signatures as well, which turned out to be quite a challenge.
The possible formation of MM from UV irradiation or electron impact of methanol-containing ices has been studied by several groups. These latter studies all found TPD peaks for an m∕z = 61 (or shifted if isotope-labeled precursors were used) between 155 and 170 K and attributed this peak to MM. Table 2 summarizes the results of these studies. According to the GC/MS spectrum of MM reported in Johnson & Stanley (1991), m∕z = 61 is one of the strongest MM signals, while the dissociative ionization peak at m∕z = 60 and the peak of the undissociated ion at m∕z = 62 are only minor contributors to the total ion current. This was also verified by the experiments in Boamah et al. (2014) and Sullivan et al. (2016). In our work, we also find that m∕z = 61 peaks at about 162 K, which differs by 6 K from GA in terms of desorption temperature. This detection is consistent with prior identification of MM in TPD, both in temperature and mass-to-charge values. In all other CO + H or H2CO + H experiments performed at 10 K, a peak at m∕z = 61 amu is found around 162 K, but this signal disappears in experiments where the ice was deposited at 25 K. This is expected because at 25 K, H-atoms have a very short residence time on the surface and therefore do not drive efficient chemistry, as illustrated earlier for the CO ↔ H2CO ↔ CH3OH reaction sequence (Watanabe & Kouchi 2002; Fuchs et al. 2009; Chuang et al. 2017). Further support for the assignment of the m∕z = 61 peak at 162 K to MM comes from TPD spectra obtained when using different isotope precursors. In Fig. 3, the corresponding TPDs are shown (top-down) after hydrogenation of 13CO, C18 O, 12CO,  , and
, and  ices. It can also be seen that when starting from CO, the desorption peak temperature of MM is slightly higher, which is probably due to the lower coverage of MM on the surface. The use of isotopes results in the corresponding shifts for the mass-to-charge value of m∕z = 61 peak of MM to account for the extramass of 13C or 18O label in the obtained ion. It should be noted that the experiments starting from H2CO+H have a higher absolute yield of MM than those starting from CO+H. In experiments 1, 2, and 3 (starting from CO), the TPD signals are weak, and in experiments 4 and 5 (starting from H2CO) the signals are clear. For all of them, the relative yield of MM to CH3OH is comparable (Table 1). The higher yield of MM when starting from H2CO is in line with the formation of MM along the H2CO ↔ CH3OH part of the hydrogenation network. Two extra hydrogenation steps are required to reach MM from CO compared to H2CO. Given these and previous findings, we conclude that MM is also formed in the CO hydrogenation chain, albeit in lower quantities compared to those of GA and EG.
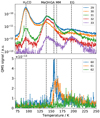 |
Fig. 2 QMS spectra of selected masses measured during a 5 K min−1 TPD after the co-deposition 2.0 ML of H2CO and 50 ML of H on top of porous amorphous water at 10 K (Exp. 1 in Table 1). The assignments of molecular species based on temperature and masses are marked in the figure. CH3OH is abbreviated to MeOH. |
Previous laboratory studies related to MM formation in the solid state.
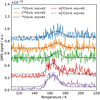 |
Fig. 3 QMS spectra of methoxymethanol during the TPD after co-deposition of H with 13CO (Exp. 1), C18O (Exp. 2), CO (Exp. 3), H |

3.2 Methoxymethanol formation through methyl formate hydrogenation
As shown in Fig. 1, it is possible, in principle, to form MM through the direct hydrogenation of methyl formate. This route,
 (R1)
(R1)
was also proposed by McGuire et al. (2017). MF is an abundant two-carbon COM observed in hot cores, hot corinos, and comets (Taquet et al. 2017; Bacmann et al. 2012, and references therein). Although it has not been detected yet in the solid-state on dust grains, it is likely one of the COMs embedded in the ice mantle (Garrod 2013). New IR data for MF ice have recently become available (Terwisscha van Scheltinga et al. 2021) that allow the search for solid MF in space.
In the present study, we experimentally tested the MF + H reaction pathway (Exp. 8). With the gold substrate at 10 K, 36.0 ML MF and 52.0 ML H are co-deposited onto the substrate over 3 h. Subsequently, the ice is warmed up from 10 to 250 K at a ramp rate of 6 K min−1 to do a TPD. The TPD spectra are presented in Fig. 4. The main desorption peak of MF is located at 135 K. At 148 K, thereis another small peak, which is 15–20 K lower than the desorption peak of MM. Following the work by Zahidi et al. (1994), we attribute this peak to the desorption of MF in the submonolayer. The interpretation of a possible MM signature is not a priori clear. However, based on the mass fragmentation pattern of MF from the NIST database, the m60∕m61 ratio should be 38.4. If there is a significant amount of MM in the ice, we would expect to find a lower m60∕m61 ratio at the MM desorption temperature of 162 K, given the extra contribution originating from MM. To look more closely for any sign of MM at ~162 K, in Fig. 5 we plot the m60 and 38.4 × m61 signal versus temperature. It is clear that these two curves are almost identical and no evidence of MM desorption can be seen at 162 K. To further verify this, in the inset, we plot the difference m60 − 38.4 × m61, and still see no desorption peak of MM at 162 K. The small difference between ~110 and ~155 K could be at least partly due to the small time-offset between the two mass channels, as the QMS can only scan mass channels one after another. Therefore, we conclude that there is insignificant MM formation for the investigated settings and available QMS sensitivity. This is in agreement with a recent study by Krim et al. (2018) who combined laboratory experiments with theoretical calculations and found that hydrogen addition to MF has a non-trivial activation energy barrier of 32.7 kJ mol−1, likely rendering this route inefficient under conditions relevant to interstellar space. This finding also agrees with Álvarez-Barcia et al. (2018) who found that the rate constant of H + MF is several orders of magnitude lower than that of H + GA based on instanton theory calculations.
Coverage of stable species at the end of 6 h of simulated co-deposition in experimental conditions.
3.3 Astrochemical modeling
3.3.1 Simulated experiments
We used Monte Carlo simulations to obtain molecular details on the exact formation route of MM. To obtain an accurate surface, ten monolayers of water were deposited onto a bare surface before the co-deposition simulation. This water layer is porous and yields an approximate surface area of 2 ML at the solid-vacuum interface. Figure 6 shows a cross-section of this water layer in light blue on top of the gray-colored grain.
For the experimental simulations, the binding energy of the H and CO was increased by 20 percent with respect to work in Simons et al. (2020) to reflect the change in ice substrate from CO-rich to H2O-rich. Figure 7 shows the surface abundance of stable species during the simulation. It can be seen that, over time, hydrogenation reactions become more efficient than other radical-radical reactions that lead to MF (blue) and MM (brown). This is a result of the formation of the first monolayer. When approaching a full monolayer of deposited CO, the probability of a newly deposited hydrogen atom to find a species increases greatly, because there are more molecules to land on top of. The efficiency of hydrogenation is thereby increased, as less hydrogen diffusion is required. This in turn decreases the probability of two nonhydrogen radicals being in close proximity because most radicals are quickly hydrogenated. This effect is more prevalent for the formation of MM because the formation of CH2OH is already quite inefficient. This is reflected by an almost fully flattened curve of MM towards the end of the simulation.
Table 3 lists the surface coverage of the noncomplex species at the end of the 6-h simulation. Generally, we obtain slightly more hydrogenated species than earlier works because of the higher n(H):n(CO) ratio used in these simulations. The absolute error in coverage is within a factor 2 uncertainty of the IR data of the experiments. Comparing the abundances of COMs with the QMS data shows that the simulations yield much more methyl formate than the experiments. This is probably the result of missing destruction routes of large molecules in the reaction network. The simulations also give a slightly higher surface abundance of MM with respect to Table 1. However, the QMS data are expected to be a lower limit with a fairly high uncertainty, and so the increase of approximately 30% is well within a reasonable margin. Overall, Table 3 shows that MM constitutes only a small fraction of all formed COMs. This is in line with experimental results reported earlier.
Finally, the co-deposition of H2CO and H yields a higher abundance of MF and MM compared to CO + H co-deposition. This can simply be attributed to the fact that fewer hydrogenation steps are required to yield its reactants CH3O and CH2OH. COMs that require HCO-dimerization (GA and EG) are not affected.
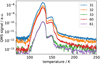 |
Fig. 4 TPD spectra of 36.0 ML methyl formate and 52.0 ML H co-deposited at 10 K and then heated up at 6 K min−1. The mass corresponding to each curve is shown in the inset. |
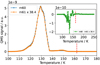 |
Fig. 5 A comparison between the QMS signal of m∕z = 60 and 61 (multiplied by 38.4 times) taken from the corresponding curves in Fig. 4. The baselines for both masses are subtracted. The inset shows the difference between the two traces. The red vertical dashed lines marks the temperature162 K at which the desorption of MM is expected. |
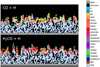 |
Fig. 6 Cross-sections of the grain mantle after 6 h of simulated experiments. |
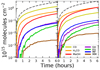 |
Fig. 7 Surface abundance of stable species during benchmark simulations of CO + H (left) and H2CO + H (right) co-deposition. These are simulations of Exp. 3 and 5 as listed in Table 1. The dashed line is the total amount of C deposited. |
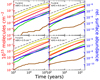 |
Fig. 8 Simulated time-evolution of the grain surface under interstellar conditions. The initial CO abundance is equal to 10.0 cm−3 in all simulations. Surface abundance is given with respect to nH. Coloring is consistent with Fig. 7. |
3.3.2 Simulated interstellar conditions
Next, we performed simulations under interstellar conditions to obtain information that helps to decide where to search for MM in astronomical observations. Firstly, we conclude that MM is formed under all relevant conditions, albeit in relatively low abundance. The formation of MM is more efficient at 12 K than at 10 K because an increased temperature allows for more efficient surface diffusion of hydrogen. Based on previous studies (Simons et al. 2020), we expect this trend to continue onto higher temperatures until hydrogen desorption. Simulations with a hydrogen abundance of 4.0 cm−3 yield more MM than those with a lower abundance of 2.5 cm−3. This is trivial because a higher hydrogen abundance directly increases the efficiency of hydrogenation reactions required for the formation of MM. This effect is more prevalent in the submonolayer regimes for reasons explained in Sect. 3.3.1, and is also reflected in the surface abundance of MM in Fig. 8.
Contrary to simulations under experimental conditions, we now see an increase in MM formation in the late stages of the simulation. This is the result of the CO freeze-out. As more CO is depleted from the gas phase, the n(H):n(CO) ratio of thegas is increased. We know from previous studies that a high n(H):n(CO) ratio increases methanol formation, with methanol being the dominant species at n(H):n(CO) ratios of six and above (Simons et al. 2020). As CH2OH is the product of methanol dehydrogenation and CH3O is the precursor of methanol, the formation of these species has a similar dependence on the n(H):n(CO) ratio to theformation of methanol. These species together can form MM when formed in close proximity on the grain. Thus, the formation of MM is more efficient at a high n(H):n(CO) ratio, which occurs when CO freeze-out has progressed sufficiently.
4 Astrophysical implications
In this study, we conclude that MM can be formed in the CO-rich layer of the ice mantle following the hydrogenation of CO or H2CO through recombining CH3O and CH2OH. The direct hydrogenation of MF is not confirmed as an efficient pathway. These findings complete the network introduced in Chuang et al. (2016). It appears that when starting from H2CO, the MM yield is higher. This confirms, not surprisingly, that the formation of MM is more efficient when a significant fraction of the CO has already been hydrogenated to H2CO and CH3OH. The work presented here indicates that the overall MM formation is (substantially) less efficient than the formation of GA or EG. In the observation toward NGC 6334I, a MM:MeOH abundance ratio of 0.03 was derived (McGuire et al. 2017). Here, we calculate this ratio for the studied pathways following a similar procedure to that presented in Chuang et al. (2017). We use m∕z values of 32 and 61 amu to quantify the methanol and MM yields, respectively. As the MM ionization cross-section for 70 eV electron impact is unavailable in the literature, we assume a similar cross-section value to that of EG, as EG and MM are isomers. The error introduced by this assumption is estimated to be less than 15%, based on the known cross-section values for MF, GA, and EG. In the right-most column of Table 1, the calculated MM:MeOH ratios are listed. The values are about 0.004–0.005 for those experiments that identified MM. This means that the solid-state formation efficiency in the laboratory is roughly a factor of six below the ratio detected in the gas phase in space by McGuire and coworkers. There could be several reasons for this. The calculated ratio may vary with other parameters, such as the surface temperature. As stated above, assumptions concerning the ionization cross-section of MM may result in underestimation of the amounts formed. The experiments may also underestimate the yield of MM because of unknown destruction mechanisms of MM in the performed experiments. Finally, as long as the mechanism transferring solid-state COMs into the gas phase is poorly understood, one has to be careful when comparing abundance ratios in both phases (Bertin et al. 2016; Ligterink et al. 2018; Chuang et al. 2018). Nonetheless, our experimental result suggests that hydrogenation of CO and/or H2CO in the outer layer of the ice mantle can at least partially account for the formation of MM. “Energetic processing” of methanol-containing ice mixtures, which has been proposed by several groups to be an efficient formation route of MM (see Table 2), likely plays an important role. The CH3O and CH2OH radicals produced by photolysis of CH3OH in CO-rich ice recombine to form MM. As the diffusion of radicals in bulk ice is typically inefficient at ~10 K, non-diffusive mechanisms are likely involved in the reactions. Jin & Garrod (2020) proposed that radicals could be produced right next to each other. In this case, chemical reactions could occur without the need to overcome a diffusion energy barrier. Mullikin et al. (2021) found that the inclusion of nonthermal reactions and suprathermal species better reproduces the low-temperature solid-phase photoprocessing in ices of dense cores such as TMC-1. In CO-rich ice, the transition from amorphous to polycrystalline phase is accompanied by the segregation and clustering of minor components in the ice, including radicals such as CH3O and CH2OH (He et al. 2021). This is also a likely mechanism to explain the formation of MM without involving diffusion. Most recently, Ishibashi et al. (2021) used the Cs+ ion pickup method to study the photolysis of CH3OH on top of the water ice surface and found that the OH radical from the dissociation of water might be important for the formation of MM. TheH addition reactions in the current study combined with all these alternative mechanisms present a more complete picture of pathways leading to the formation of MM.
From simulations in interstellar conditions, we conclude that MM is most likely found in prestellar objects with a high n(H):n(CO) gas-phase ratio. These are predominantly late-stage dark clouds or early-stage hot cores with a progressed CO freeze-out. IRAS 16293–2422 A is such an object, and has been observed in the ALMA-PILS survey (Manigand et al. 2020). An observation of MM has been reported in the survey. However, as this is a gas-phase observation, we cannot make a direct comparison with this study to investigate the formation route because many of the precursors such as H2CO are known to have rich gas-phase chemistry as well. Scheduled observations with JWST will allow us to elaborate more accurately on the grain-surface chemistry, although recently it was found that it is exceptionally hard to pre-deposit pure MM ice and record high-resolution IR spectra as for other frozen COMs (Rachid et al. 2021). Solid MM is clearly much harder to tackle than its gas phase equivalent.
5 Conclusions
In this work, we carried out laboratory experiments under prestellar core relevant conditions and modeling to study the astrochemical relevance of hydrogenation reactions of CO-ice, H2CO-ice, and CH3OCHO-ice as pathwaystoward the formation of methoxymethanol. We conclude that the reactions between atomic hydrogen and CO and H2CO followed by CH3O and CH2OH radical recombinations (as indicated in Chuang et al. 2017) produce methoxymethanol, but generally with a (substantially) lower efficiency than other products in the CO ice hydrogenation chain. Even though the overall ratio of methoxymethanol formed in the solid state is lower than found in observational gas-phase studies, we conclude that “non-energetic" solid-state processes in the CO-rich layer of the ice mantle take place and will, at least partially, contribute to the formation of methoxymethanol in dense clouds.
Acknowledgements
This work has been financially supported through an NWO grant within the framework of the Dutch Astrochemistry Network II. We thank Julie Korsmeyer for her technical assistance. J.H. is involved in research that is supported through the European Research Council under the Horizon 2020 Framework Program via the ERC Advanced Grant Origins 83 24 28. G.F. acknowledges financial support from the Russian Ministry of Science and Higher Education via the State Assignment Contract. FEUZ-2020-0038. S.I. acknowledges support from the Royal Society.
References
- Álvarez-Barcia, S., Russ, P., Kästner, J., & Lamberts, T. 2018, MNRAS, 479, 2007 [Google Scholar]
- Bacmann, A., Taquet, V., Faure, A., Kahane, C., & Ceccarelli, C. 2012, A&A, 541, L12 [NASA ADS] [CrossRef] [EDP Sciences] [Google Scholar]
- Belloche, A., Müller, H. S. P., Menten, K. M., Schilke, P., & Comito, C. 2013, A&A, 559, A47 [NASA ADS] [CrossRef] [EDP Sciences] [Google Scholar]
- Bertin, M., Romanzin, C., Doronin, M., et al. 2016, ApJ, 817, L12 [NASA ADS] [CrossRef] [Google Scholar]
- Boamah, M. D., Sullivan, K. K., Shulenberger, K. E., et al. 2014, Faraday Discuss., 168, 249 [NASA ADS] [CrossRef] [Google Scholar]
- Boogert, A. C. A., Gerakines, P. A., & Whittet, D. C. B. 2015, ARA&A, 53, 541 [Google Scholar]
- Boyer, M. C., Boamah, M. D., Sullivan, K. K., et al. 2014, J. Phys. Chem. C, 118, 22592 [CrossRef] [Google Scholar]
- Butscher, T., Duvernay, F., Rimola, A., Segado-Centellas, M., & Chiavassa, T. 2017, Phys. Chem. Chem. Phys., 19, 2857 [NASA ADS] [CrossRef] [Google Scholar]
- Butscher, T., Duvernay, F., Danger, G., et al. 2019, MNRAS, 486, 1953 [NASA ADS] [CrossRef] [Google Scholar]
- Chuang, K. J., Fedoseev, G., Ioppolo, S., van Dishoeck, E. F., & Linnartz, H. 2016, MNRAS, 455, 1702 [Google Scholar]
- Chuang, K. J., Fedoseev, G., Qasim, D., et al. 2017, MNRAS, 467, 2552 [NASA ADS] [Google Scholar]
- Chuang, K. J., Fedoseev, G., Qasim, D., et al. 2018, ApJ, 853, 102 [NASA ADS] [CrossRef] [Google Scholar]
- Cooper, A. M., & Kästner, J. 2019, J. Phys. Chem. A, 123, 9061 [NASA ADS] [CrossRef] [Google Scholar]
- Cuppen, H. M., & Herbst, E. 2007, ApJ, 668, 294 [Google Scholar]
- Cuppen, H. M., van Dishoeck, E. F., Herbst, E., & Tielens, A. G. G. M. 2009, A&A, 508, 275 [NASA ADS] [CrossRef] [EDP Sciences] [Google Scholar]
- Cuppen, H. M., Karssemeijer, L. J., & Lamberts, T. 2013, Chem. Rev., 113, 8840 [NASA ADS] [CrossRef] [Google Scholar]
- Fedoseev, G., Cuppen, H. M., Ioppolo, S., Lamberts, T., & Linnartz, H. 2015, MNRAS, 448, 1288 [NASA ADS] [CrossRef] [Google Scholar]
- Fedoseev, G., Chuang, K. J., Ioppolo, S., et al. 2017, ApJ, 842, 52 [Google Scholar]
- Fuchs, G. W., Cuppen, H. M., Ioppolo, S., et al. 2009, A&A, 505, 629 [NASA ADS] [CrossRef] [EDP Sciences] [Google Scholar]
- Garrod, R. T. 2013, ApJ, 765, 60 [Google Scholar]
- Harris, T., Lee, D., Blumberg, M., & Arumainayagam, C. 1995, J. Phys. Chem., 99, 9530 [CrossRef] [Google Scholar]
- He, J., Clements, A. R., Emtiaz, S., et al. 2019, ApJ, 878, 94 [NASA ADS] [CrossRef] [Google Scholar]
- He, J., Toriello, F. E., Emtiaz, S. M., Henning, T., & Vidali, G. 2021, ApJ, 915, L23 [NASA ADS] [CrossRef] [Google Scholar]
- Herbst, E., & van Dishoeck, E. F. 2009, ARA&A, 47, 427 [NASA ADS] [CrossRef] [Google Scholar]
- Hudson, R. L., & Gerakines, P. A. 2019, MNRAS, 482, 4009 [NASA ADS] [CrossRef] [Google Scholar]
- Inostroza-Pino, N., Mardones, D., Ge, J. J. X., & MacLeod-Carey, D. 2020, A&A, 641, A14 [EDP Sciences] [Google Scholar]
- Ioppolo, S., Fedoseev, G., Lamberts, T., Romanzin, C., & Linnartz, H. 2013, Rev. Sci. Intrum., 84, 073112 [NASA ADS] [CrossRef] [Google Scholar]
- Ishibashi, A., Hidaka, H., Oba, Y., Kouchi, A., & Watanabe, N. 2021, ApJ, 921, L13 [NASA ADS] [CrossRef] [Google Scholar]
- Jin, M., & Garrod, R. T. 2020, ApJS, 249, 26 [Google Scholar]
- Johnson, R. A., & Stanley, A. E. 1991, Appl. Spectr., 45, 218 [NASA ADS] [CrossRef] [Google Scholar]
- Jørgensen, J. K., Favre, C., Bisschop, S. E., et al. 2012, ApJ, 757, L4 [Google Scholar]
- Keane, J. V., Tielens, A. G. G. M., Boogert, A. C. A., Schutte, W. A., & Whittet, D. C. B. 2001, A&A, 376, 254 [NASA ADS] [CrossRef] [EDP Sciences] [Google Scholar]
- Krim, L., Jonusas, M., Guillemin, J.-C., Yáñez, M., & Lamsabhi, A. M. 2018, Phys. Chem. Chem. Phys., 20, 19971 [NASA ADS] [CrossRef] [Google Scholar]
- Lamberts, T. 2018, A&A, 615, L2 [NASA ADS] [CrossRef] [EDP Sciences] [Google Scholar]
- Lee, C.-F., Li, Z.-Y., Ho, P. T. P., et al. 2017, ApJ, 843, 27 [NASA ADS] [CrossRef] [Google Scholar]
- Ligterink, N. F. W., Walsh, C., Bhuin, R. G., et al. 2018, A&A, 612, A88 [NASA ADS] [CrossRef] [EDP Sciences] [Google Scholar]
- Linnartz, H., Ioppolo, S., & Fedoseev, G. 2015, Int. Rev. Phys. Chem., 34, 205 [Google Scholar]
- Maity, S., Kaiser, R. I., & Jones, B. M. 2015, Phys. Chem. Chem. Phys., 17, 3081 [NASA ADS] [CrossRef] [Google Scholar]
- Manigand, S., Jørgensen, J. K., Calcutt, H., et al. 2020, A&A, 635, A48 [NASA ADS] [CrossRef] [EDP Sciences] [Google Scholar]
- McGuire, B. A. 2018, ApJS, 239, 17 [Google Scholar]
- McGuire, B. A., Shingledecker, C. N., Willis, E. R., et al. 2017, ApJ, 851, L46 [Google Scholar]
- Modica, P., & Palumbo, M. E. 2010, A&A, 519, A22 [NASA ADS] [CrossRef] [EDP Sciences] [Google Scholar]
- Mullikin, E., Anderson, H., O’Hern, N., et al. 2021, ApJ, 910, 72 [NASA ADS] [CrossRef] [Google Scholar]
- Öberg, K. I. 2016, Chem. Rev., 116, 9631 [Google Scholar]
- Paardekooper, D. M., Bossa, J. B., & Linnartz, H. 2016, A&A, 592, A67 [NASA ADS] [CrossRef] [EDP Sciences] [Google Scholar]
- Pontoppidan, K. M., Boogert, A. C. A., Fraser, H. J., et al. 2008, ApJ, 678, 1005 [NASA ADS] [CrossRef] [Google Scholar]
- Qasim, D., Witlox, M. J. A., Fedoseev, G., et al. 2020, Rev. Sci. Instrum., 91, 054501 [NASA ADS] [CrossRef] [Google Scholar]
- Rachid, M. G., Brunken, N., de Boe, D., et al. 2021, A&A, 653, A116 [NASA ADS] [CrossRef] [EDP Sciences] [Google Scholar]
- Requena-Torres, M. A., Martin-Pintado, J., Rodríguez-Franco, A., et al. 2006, A&A, 455, 971 [NASA ADS] [CrossRef] [EDP Sciences] [Google Scholar]
- Schneider, H., Caldwell-Overdier, A., Coppieters’t Wallant, S., et al. 2019, MNRAS, 485, L19 [NASA ADS] [CrossRef] [Google Scholar]
- Simons, M. A. J., Lamberts, T., & Cuppen, H. M. 2020, A&A, 634, A52 [NASA ADS] [CrossRef] [EDP Sciences] [Google Scholar]
- Stevenson, K. P., Kimmel, G. A., Dohnalek, Z., Smith, R. S., & Kay, B. D. 1999, Science, 283, 1505 [NASA ADS] [CrossRef] [Google Scholar]
- Sullivan, K. K., Boamah, M. D., Shulenberger, K. E., et al. 2016, MNRAS, 460, 664 [NASA ADS] [CrossRef] [Google Scholar]
- Taquet, V., Wirström, E. S., Charnley, S. B., et al. 2017, A&A, 607, A20 [NASA ADS] [CrossRef] [EDP Sciences] [Google Scholar]
- Terwisscha van Scheltinga, J., Ligterink, N. F. W., Boogert, A. C. A., van Dishoeck, E. F., & Linnartz, H. 2018, A&A, 611, A35 [NASA ADS] [CrossRef] [EDP Sciences] [Google Scholar]
- Terwisscha van Scheltinga, J., Marcandalli, G., McClure, M. K., Hogerheijde, M. R., & Linnartz, H. 2021, A&A, 651, A95 [NASA ADS] [CrossRef] [EDP Sciences] [Google Scholar]
- Watanabe, N.,& Kouchi, A. 2002, ApJ, 571, L173 [Google Scholar]
- Zahidi, E., Castonguay, M., & McBreen, P. 1994, J. Am. Chem. Soc., 116, 5847 [CrossRef] [Google Scholar]
All Tables
Coverage of stable species at the end of 6 h of simulated co-deposition in experimental conditions.
All Figures
|
Fig. 1 Extended COM formation network as obtained from the CO, H2CO, and CH3OH hydrogenation experiments. Solid arrows indicate the reaction pathways confirmed or suggested in this study. Dashed arrows indicate the pathways that are generally less efficient. This figure is updated from Fig. 8 in Chuang et al. (2016). New additions based on this work are shown in red. |
| In the text | |
|
Fig. 2 QMS spectra of selected masses measured during a 5 K min−1 TPD after the co-deposition 2.0 ML of H2CO and 50 ML of H on top of porous amorphous water at 10 K (Exp. 1 in Table 1). The assignments of molecular species based on temperature and masses are marked in the figure. CH3OH is abbreviated to MeOH. |
| In the text | |
|
Fig. 3 QMS spectra of methoxymethanol during the TPD after co-deposition of H with 13CO (Exp. 1), C18O (Exp. 2), CO (Exp. 3), H |
| In the text | |
|
Fig. 4 TPD spectra of 36.0 ML methyl formate and 52.0 ML H co-deposited at 10 K and then heated up at 6 K min−1. The mass corresponding to each curve is shown in the inset. |
| In the text | |
|
Fig. 5 A comparison between the QMS signal of m∕z = 60 and 61 (multiplied by 38.4 times) taken from the corresponding curves in Fig. 4. The baselines for both masses are subtracted. The inset shows the difference between the two traces. The red vertical dashed lines marks the temperature162 K at which the desorption of MM is expected. |
| In the text | |
|
Fig. 6 Cross-sections of the grain mantle after 6 h of simulated experiments. |
| In the text | |
|
Fig. 7 Surface abundance of stable species during benchmark simulations of CO + H (left) and H2CO + H (right) co-deposition. These are simulations of Exp. 3 and 5 as listed in Table 1. The dashed line is the total amount of C deposited. |
| In the text | |
|
Fig. 8 Simulated time-evolution of the grain surface under interstellar conditions. The initial CO abundance is equal to 10.0 cm−3 in all simulations. Surface abundance is given with respect to nH. Coloring is consistent with Fig. 7. |
| In the text | |
Current usage metrics show cumulative count of Article Views (full-text article views including HTML views, PDF and ePub downloads, according to the available data) and Abstracts Views on Vision4Press platform.
Data correspond to usage on the plateform after 2015. The current usage metrics is available 48-96 hours after online publication and is updated daily on week days.
Initial download of the metrics may take a while.