Free Access
Fig. 6
Download original image
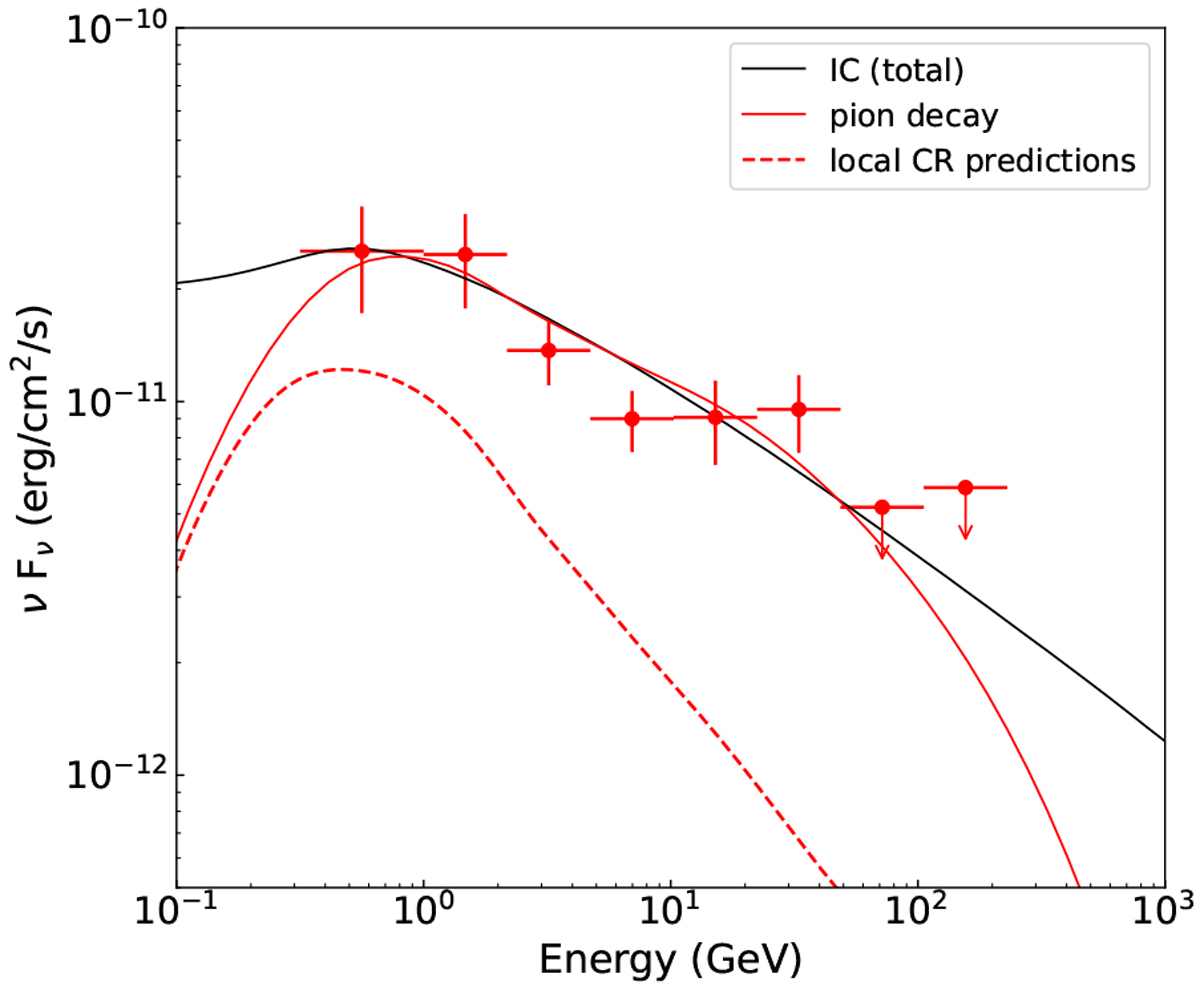
γ-ray SED of the extended component 4FGL J1912.7+0957 is the same as in Fig. 4. The dashed red curve represents the predicted γ-ray emission assuming that the CR spectra therein are the same as those measured locally by AMS-02 (Aguilar et al. 2015).
Current usage metrics show cumulative count of Article Views (full-text article views including HTML views, PDF and ePub downloads, according to the available data) and Abstracts Views on Vision4Press platform.
Data correspond to usage on the plateform after 2015. The current usage metrics is available 48-96 hours after online publication and is updated daily on week days.
Initial download of the metrics may take a while.