Fig. 4
Download original image
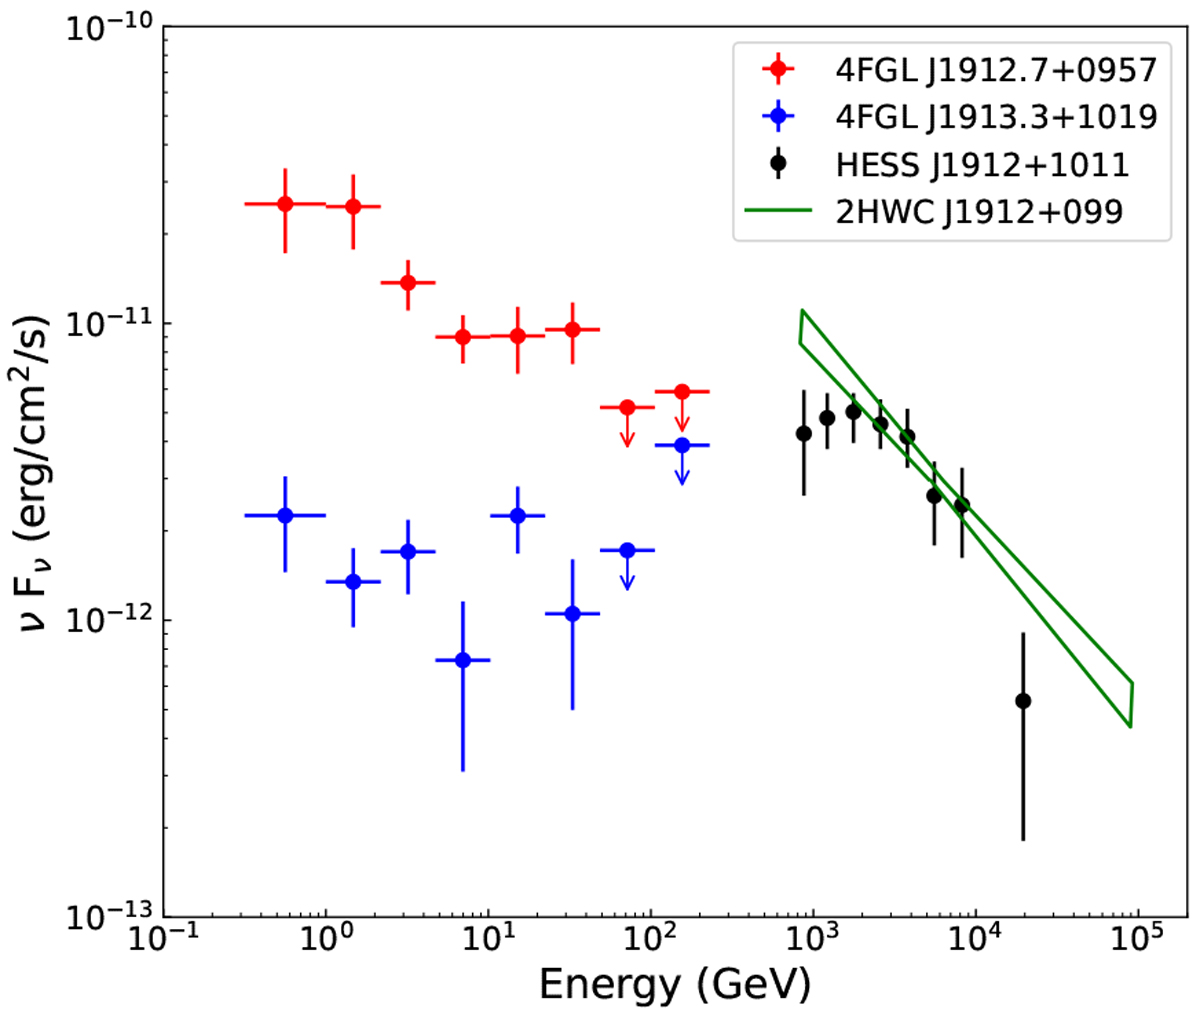
SED of 4FGL J1912.7+0957 (red data) extracted from the H2 spatial model. Statistical and systematic errors are considered. The blue data points are derived from the 4FGL J1913.3+1019 at the best two positions, as shown in Fig. 2. The black data points represent the HESS energy flux spectra taken from HESS J1912+101, and the green butterfly shows the best-fit power-law model with Γ = 2.64 ± 0.06 of 2HWC J1912+099.
Current usage metrics show cumulative count of Article Views (full-text article views including HTML views, PDF and ePub downloads, according to the available data) and Abstracts Views on Vision4Press platform.
Data correspond to usage on the plateform after 2015. The current usage metrics is available 48-96 hours after online publication and is updated daily on week days.
Initial download of the metrics may take a while.