Free Access
Fig. 3
Download original image
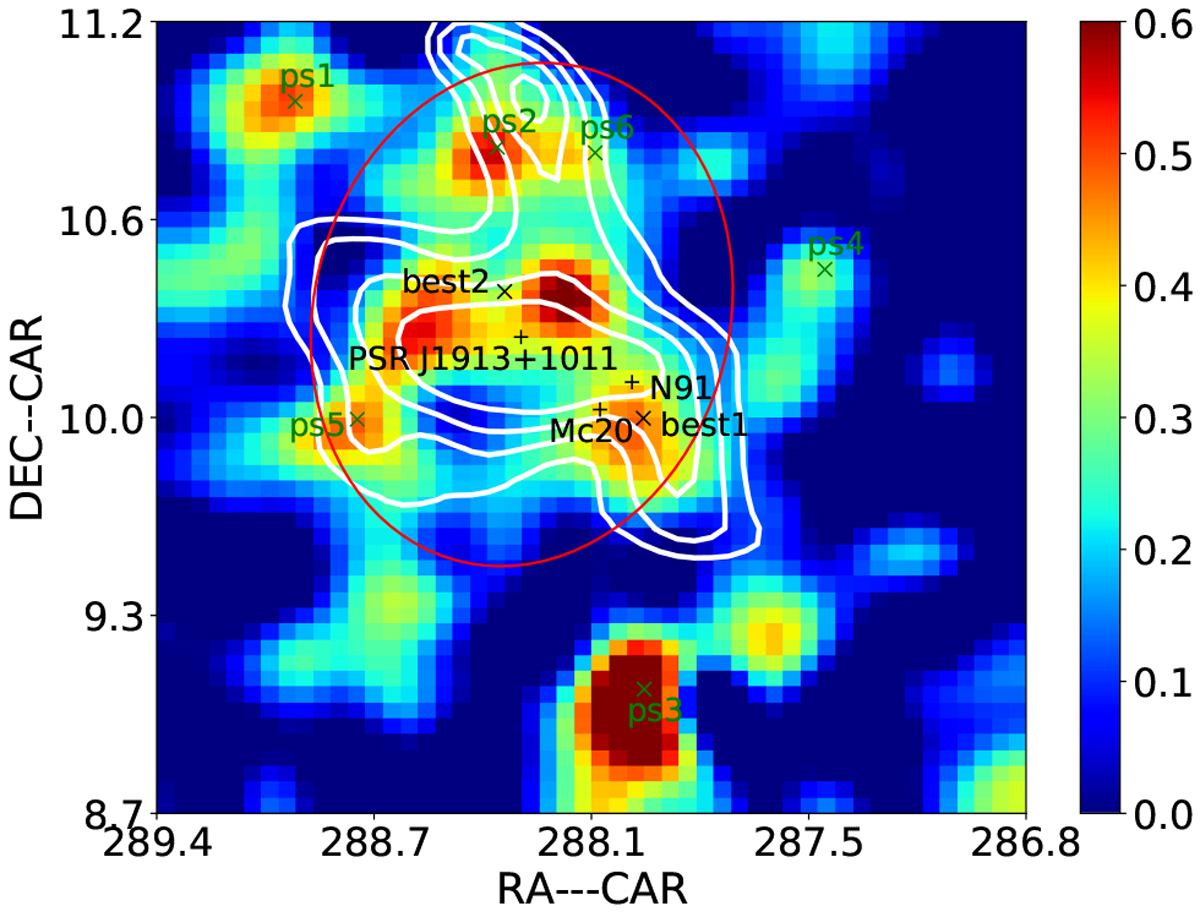
Residual map above 10 GeV near the HESS J1912+101 region after subtracting the background sources and 4FGL J1913.3+1019. The red ellipse with a size of 0.8° × 0.6° represents the spatial model that replaces the components of 4FGL J1912.7+0957, ps2, ps5, and ps6. The white contours represent the H2 distribution.
Current usage metrics show cumulative count of Article Views (full-text article views including HTML views, PDF and ePub downloads, according to the available data) and Abstracts Views on Vision4Press platform.
Data correspond to usage on the plateform after 2015. The current usage metrics is available 48-96 hours after online publication and is updated daily on week days.
Initial download of the metrics may take a while.