Fig. 2
Download original image
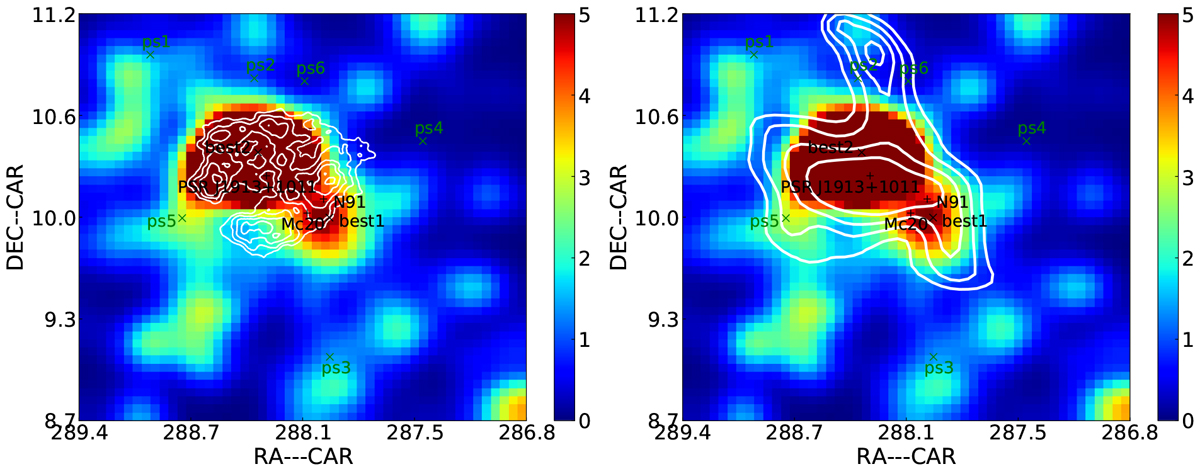
Left: Fermi-LAT TS residual map above 10 GeV around HESS J1912+101 after subtracting the sources 4FGL J1912.7+0957, 4FGL J1913.3+1019, 4FGL J1914.7+1012, and 4FGL J1911.7+1014 from the primary model. The size is that of the 2.5° × 2.5° region smoothed with a Gaussian filter of 0.25°, and each pixel is 0.05° × 0.05°. The pluses shows the positions of PSR J1913+1011, Mc20, and N91. The crosses indicate the twobest-fit emission peaks for 4FGL J1912.7+0957 and 4FGL J1913.3+1019. The VHE γ-ray excess as seen by HESS is shown as white contours. We removed the six candidate sources labeled ps1 to ps6 from the TS map. The white contours show the TeV γ-ray emission of HESS J1912+101. Right: same TS residual map as in left panel, but the contours of the H2 column density derived in Sect. 3 are overlaid.
Current usage metrics show cumulative count of Article Views (full-text article views including HTML views, PDF and ePub downloads, according to the available data) and Abstracts Views on Vision4Press platform.
Data correspond to usage on the plateform after 2015. The current usage metrics is available 48-96 hours after online publication and is updated daily on week days.
Initial download of the metrics may take a while.