Fig. A.1.
Download original image
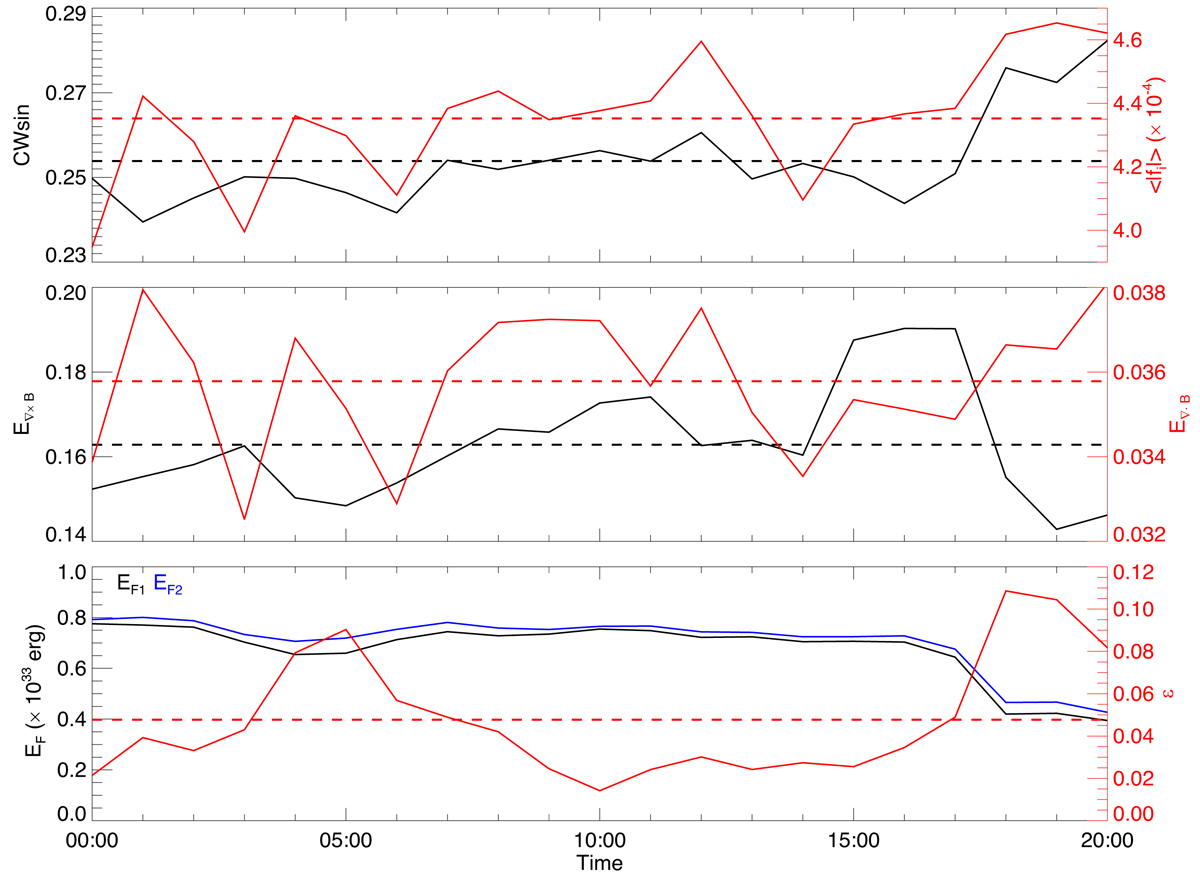
Evolution of the CWsin and ⟨|fi|⟩ during 00:00 UT to 20:00 UT on 2014 November 7, shown in the top panel. CWsin and ⟨|fi|⟩ are metrics to measure the quality of force-freeness and divergence-freeness of a NLFFF extrapolation. The black and red dashed lines are average values of the CWsin and ⟨|fi|⟩, respectively. Middle panel: Distributions of the E∇ × B and E∇ ⋅ B during 00:00 UT to 20:00 UT. These two quantities can also be used to measure the force-freeness and divergence-freeness of the extrapolated fields. The black and red dashed lines show the average values of these two metrics, respectively. Bottom panel: Evolution of the free energy. Black and blue lines show the free energy calculated with different ways, the red solid line shows their relative error, and the red dashed line shows the average of the relative error. See the text for details.
Current usage metrics show cumulative count of Article Views (full-text article views including HTML views, PDF and ePub downloads, according to the available data) and Abstracts Views on Vision4Press platform.
Data correspond to usage on the plateform after 2015. The current usage metrics is available 48-96 hours after online publication and is updated daily on week days.
Initial download of the metrics may take a while.