Fig. 5.
Download original image
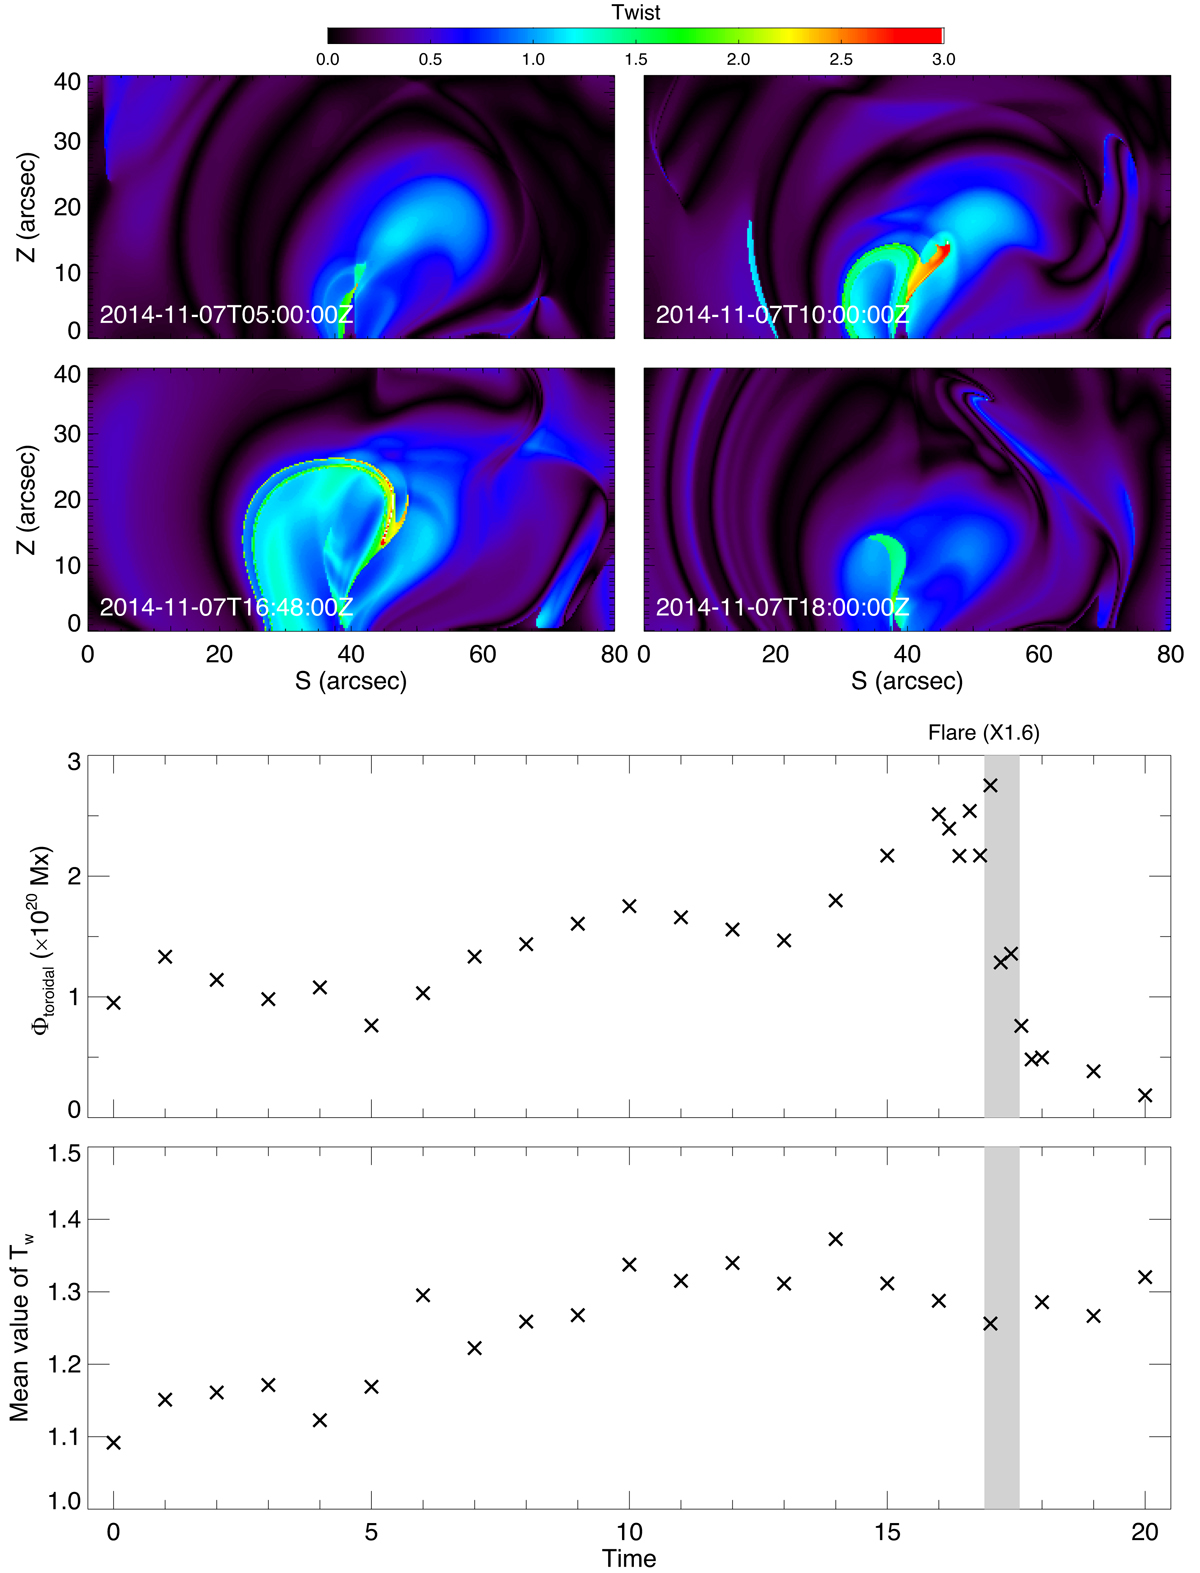
Evolution of twisted flux of the MFR. Top and middle: evolution of the twist number of the MFR on the cross section whose location is denoted by the red line on the top-middle panel in Fig. 4. Bottom: toroidal magnetic fluxes of the MFR computed on the same cross section, and the fluxes are integrated with only those having Tw ≥ 1.
Current usage metrics show cumulative count of Article Views (full-text article views including HTML views, PDF and ePub downloads, according to the available data) and Abstracts Views on Vision4Press platform.
Data correspond to usage on the plateform after 2015. The current usage metrics is available 48-96 hours after online publication and is updated daily on week days.
Initial download of the metrics may take a while.