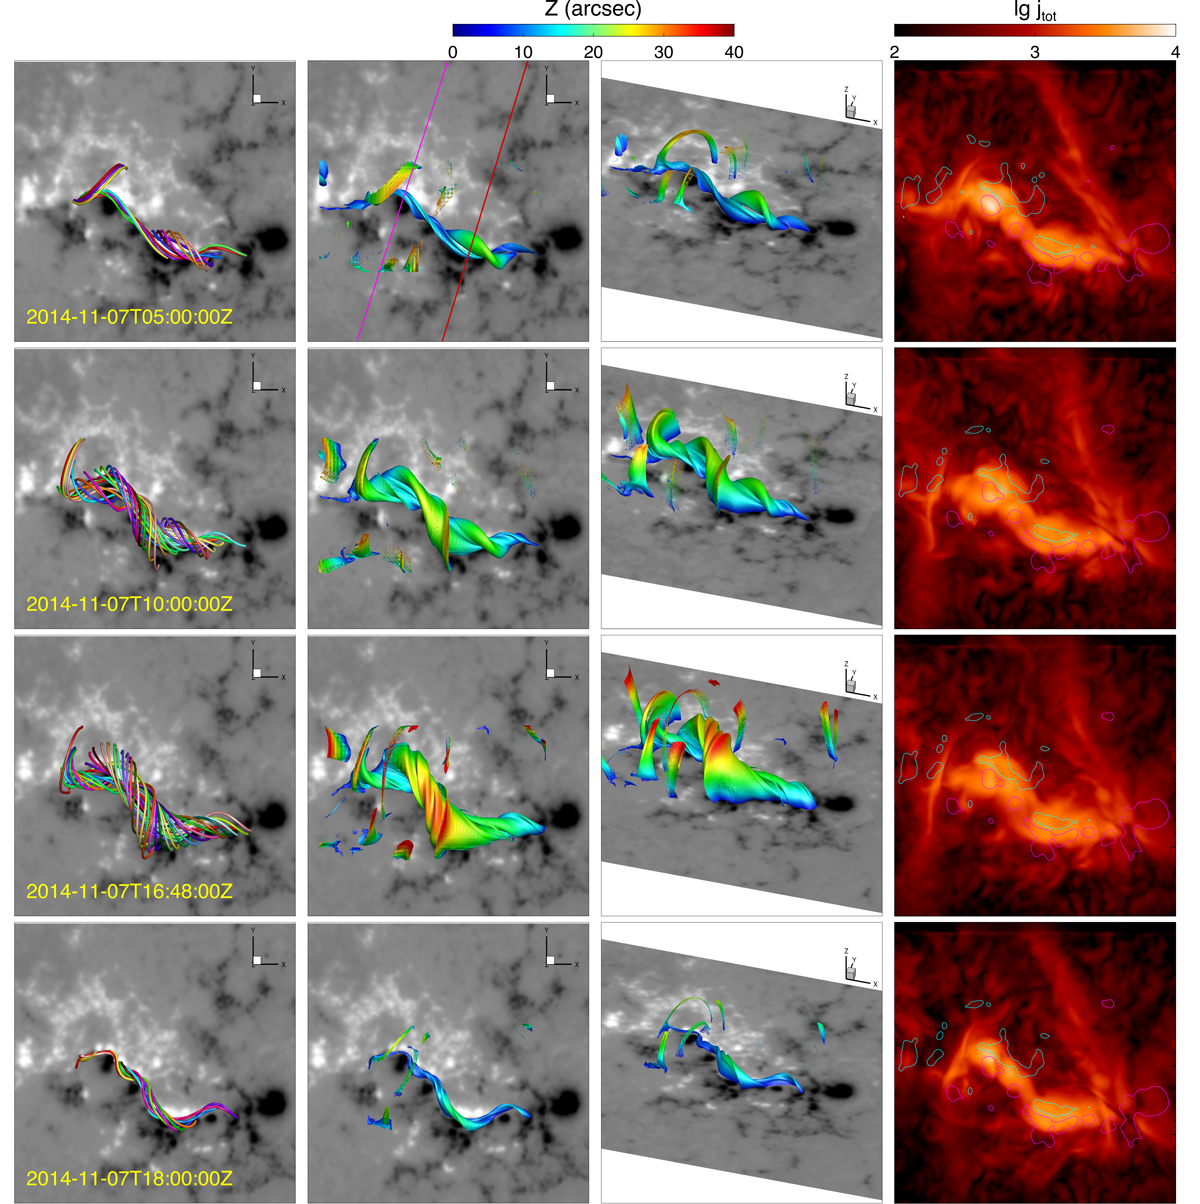
Fig. 4.
Download original image
Structure and evolution of the MFR and the current density before to after the X1.6 flare. Left column: sampled magnetic field lines shown with different colors for a better view of each field line. Two middle columns: Iso-surface of magnetic twist number Tw = 1 in the x − y plane and in 3D, the structure is false-colored by the value of height z in units of arcsecond (or 720 km). Right column: evolution of the current distribution which is calculated by integration of the current density along the z direction.
Current usage metrics show cumulative count of Article Views (full-text article views including HTML views, PDF and ePub downloads, according to the available data) and Abstracts Views on Vision4Press platform.
Data correspond to usage on the plateform after 2015. The current usage metrics is available 48-96 hours after online publication and is updated daily on week days.
Initial download of the metrics may take a while.