Fig. 2.
Download original image
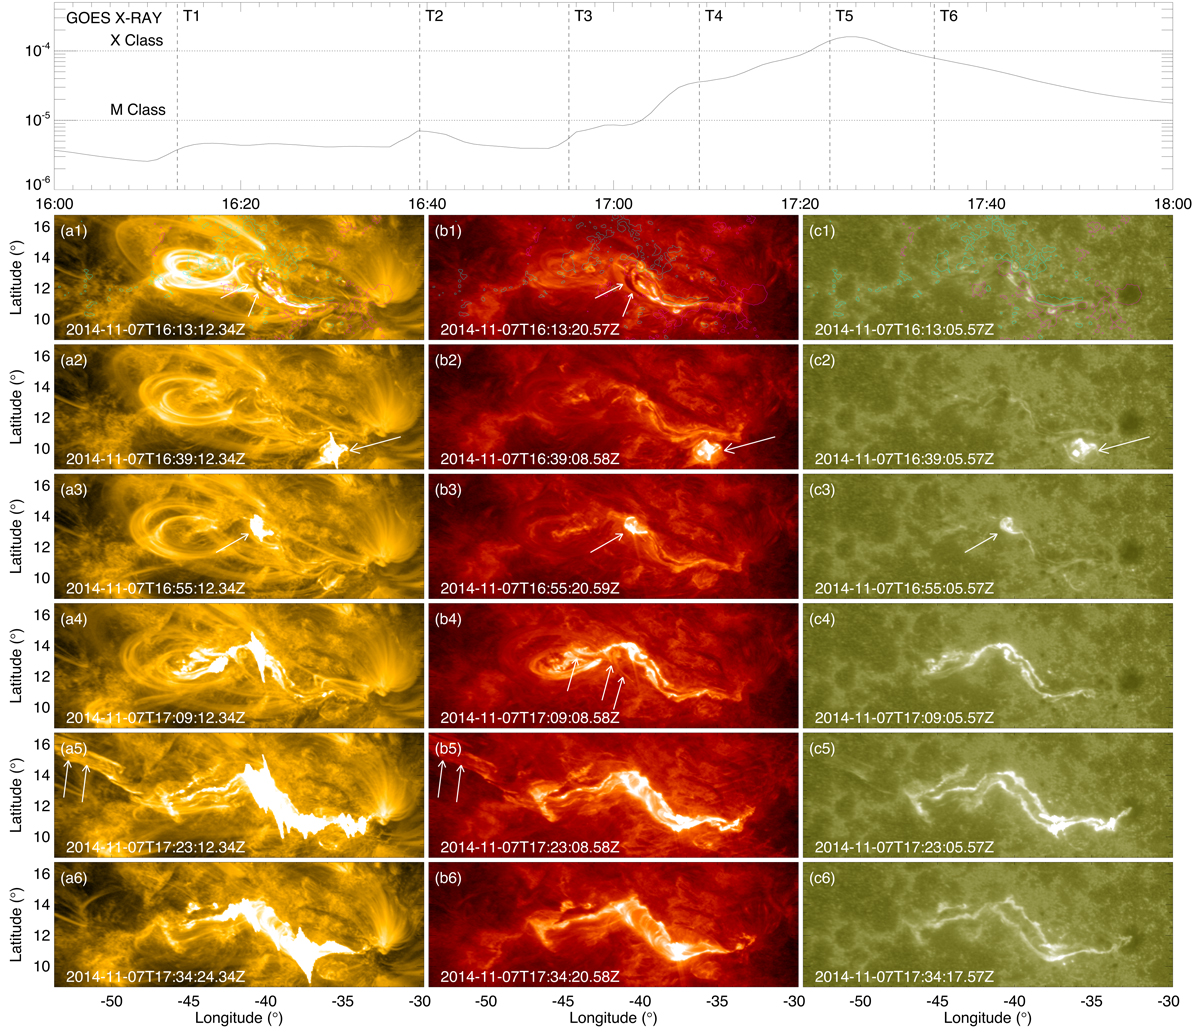
Evolution of the GOES soft X-ray flux during 16:00:00 UT to 18:00:00 UT (top panel) and observation of the X1.6 flare in 171 Å (a1–a6), 304 Å (b1–b6), and 1600 Å (c1–c6) bands. The labels T1 to T6 correspond to the time shown in the following panels. The overlaid contours are shown for Bz = 500 G (colored in cyan) and −500 G (pink) in panels a1, b1 and c1. Arrows in panels a1 and b1 indicate the location of the filament. Arrows in panels a2, b2 and c2 point to the circular ribbon of a C7.0 flare. Arrows in panels a3, b3 and c3 indicate the initiation of the X1.6 flare. Arrows in panel b4 show the rising filament with a helical shape. Arrows in panels a5 and b5 point to the eruption of the filament. An animation of this figure is provided online.
Current usage metrics show cumulative count of Article Views (full-text article views including HTML views, PDF and ePub downloads, according to the available data) and Abstracts Views on Vision4Press platform.
Data correspond to usage on the plateform after 2015. The current usage metrics is available 48-96 hours after online publication and is updated daily on week days.
Initial download of the metrics may take a while.