Fig. A.2.
Download original image
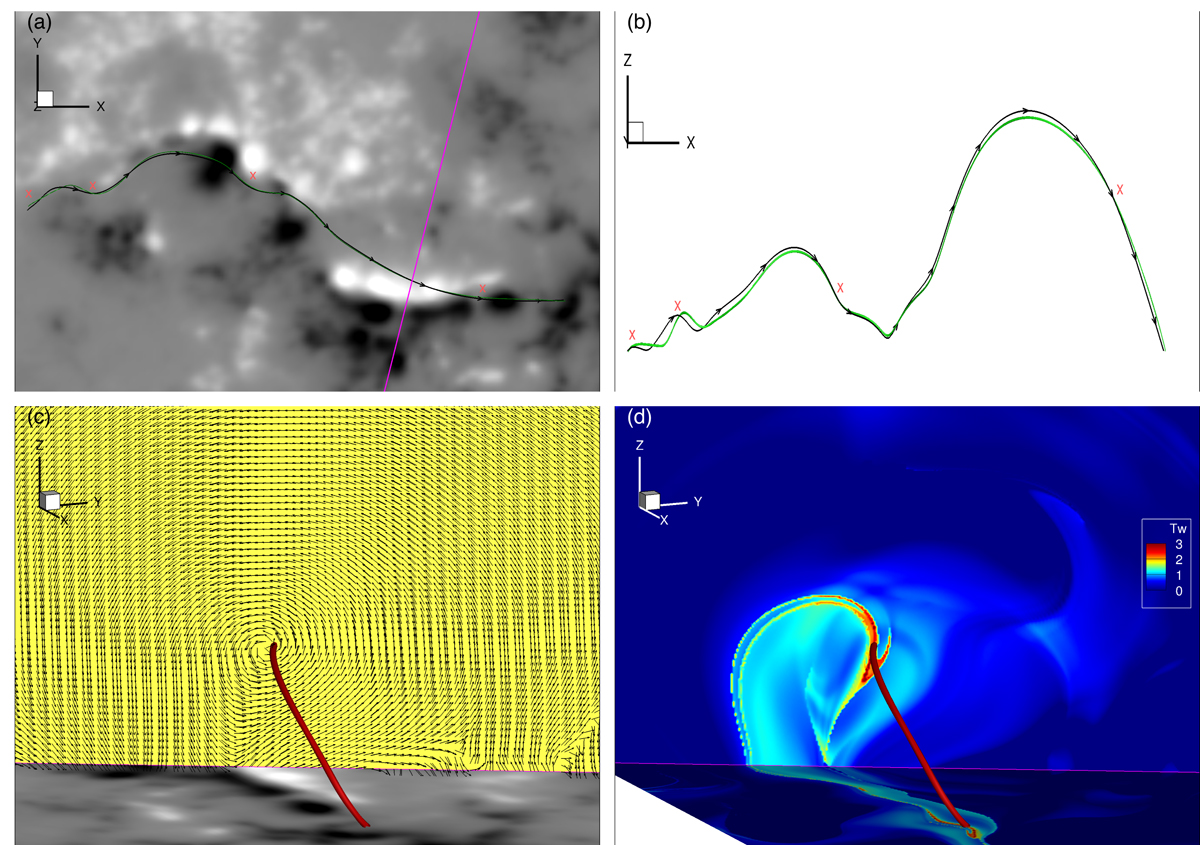
Detailed presentation of the magnetic flux rope near its peak phase (at time of 16:48 UT on November 7). (a) Two sampled field lines near the axis of the rope. It clearly shows that the winding number of magnetic field lines exceeds three turns. (b) Side view of the field lines shown in the top panel. (c) Vertical cross-section of the MFR whose location is marked by the purple line in panel (a). The arrows show the directions of the transverse field on the slice, as they form spirals centered at the rope’s axis denoted by the red thick line. (d) Same cross section of the axis as in (c) but colored with Tw values, the axis located at the area where the Tw value is the largest.
Current usage metrics show cumulative count of Article Views (full-text article views including HTML views, PDF and ePub downloads, according to the available data) and Abstracts Views on Vision4Press platform.
Data correspond to usage on the plateform after 2015. The current usage metrics is available 48-96 hours after online publication and is updated daily on week days.
Initial download of the metrics may take a while.