Fig. 1.
Download original image
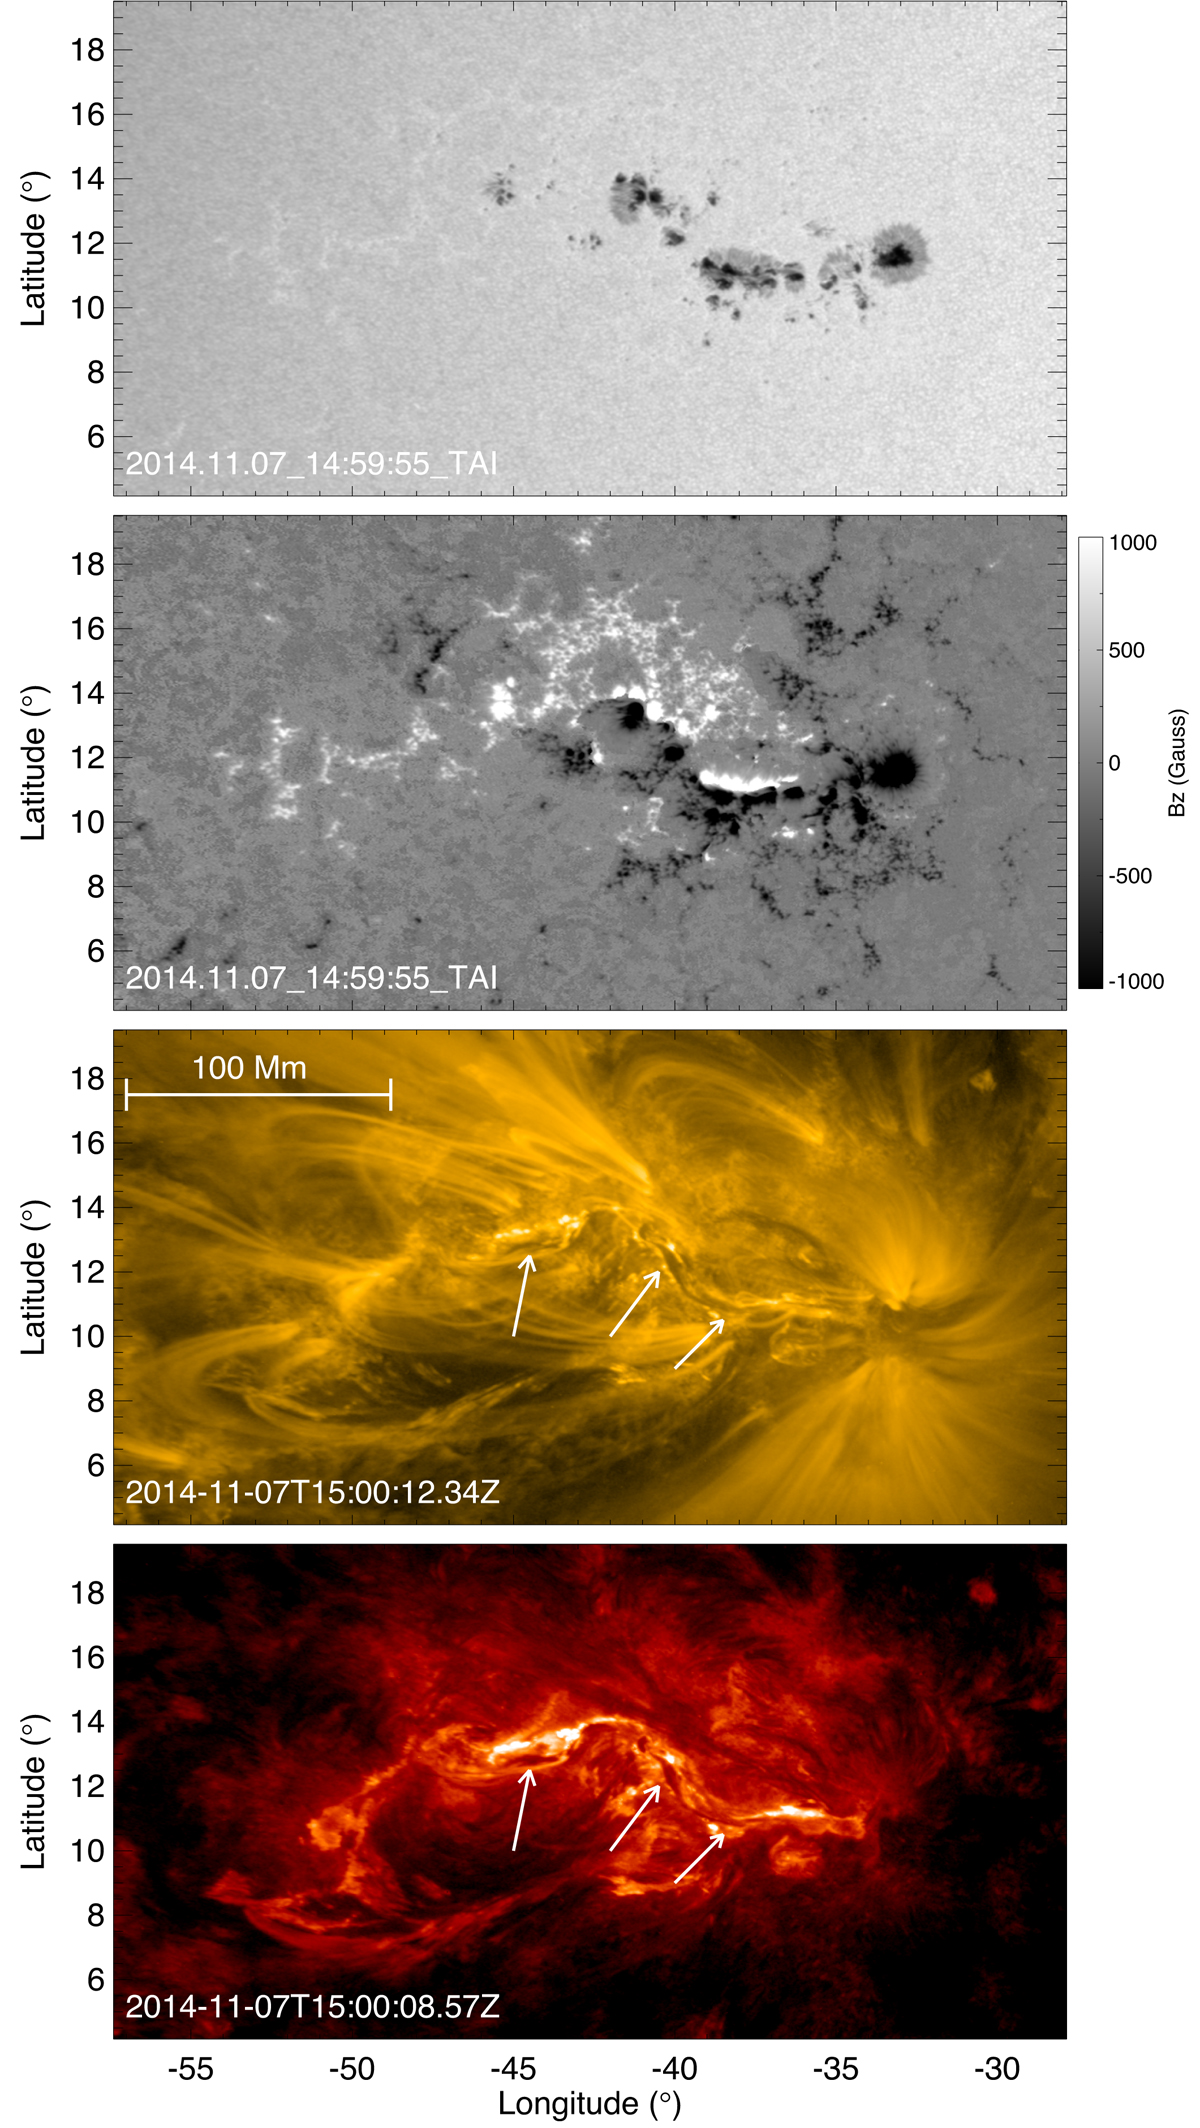
Basic structure of the studied region seen by SDO/HMI and AIA. Top panel: solar surface with HMI continuum observation. Second panel: vertical component of photospheric magnetic field. Bottom two panels: AIA 171 Å and 304 Å images, respectively. The arrows in the panels mark the location of the filament system. The axes are labeled by the heliographic longitude and latitude from the center of solar disk.
Current usage metrics show cumulative count of Article Views (full-text article views including HTML views, PDF and ePub downloads, according to the available data) and Abstracts Views on Vision4Press platform.
Data correspond to usage on the plateform after 2015. The current usage metrics is available 48-96 hours after online publication and is updated daily on week days.
Initial download of the metrics may take a while.