Fig. 6.
Download original image
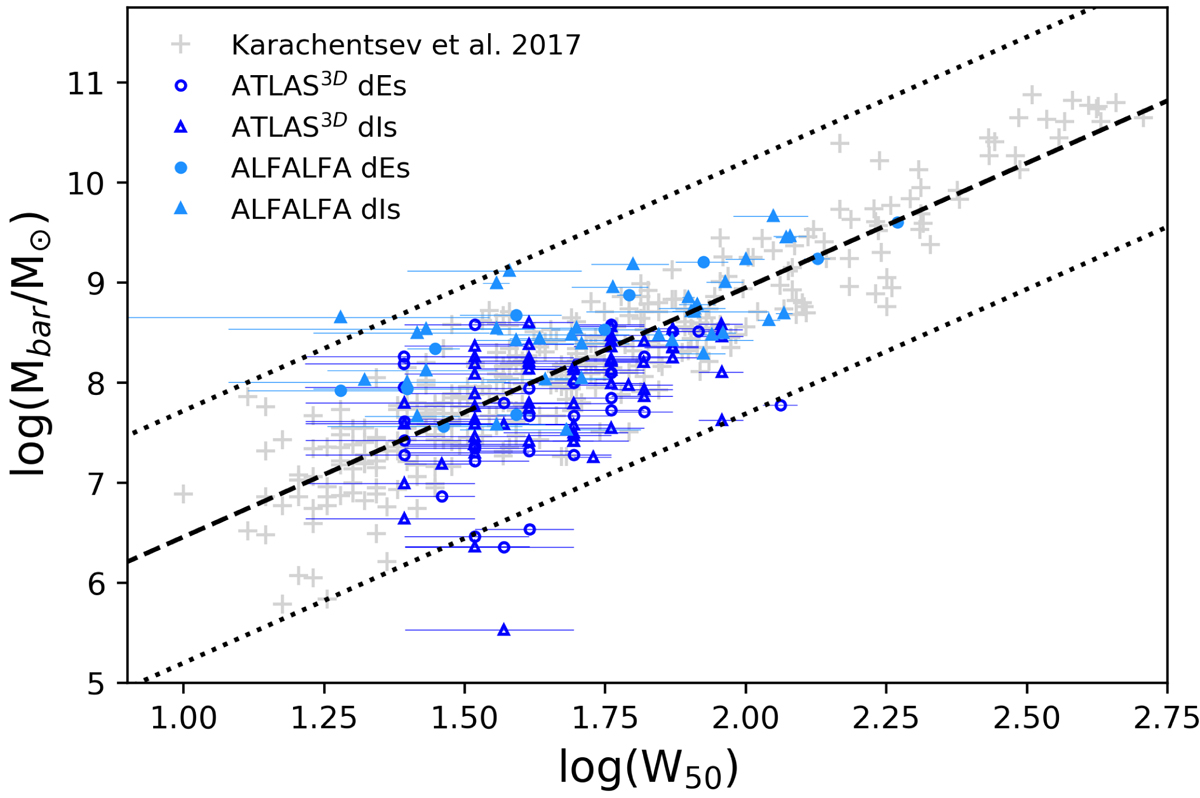
BTFR for the MATLAS dwarfs with an HI line detection in the ATLAS3D HI survey (blue markers) and in the ALFALFA survey (light blue markers), as compared to the sample of dwarfs galaxies in the LV (gray crosses) from Karachentsev et al. (2017). The dashed line represents the linear relation fitted by Karachentsev et al. (2017). The dotted lines correspond to the maximum scatter of ±1.26 dex for the LV sample. We represent the MATLAS dEs and dIs with circles and triangles, respectively. We use the estimated errors on the velocities for the error bars.
Current usage metrics show cumulative count of Article Views (full-text article views including HTML views, PDF and ePub downloads, according to the available data) and Abstracts Views on Vision4Press platform.
Data correspond to usage on the plateform after 2015. The current usage metrics is available 48-96 hours after online publication and is updated daily on week days.
Initial download of the metrics may take a while.