Fig. 5.
Download original image
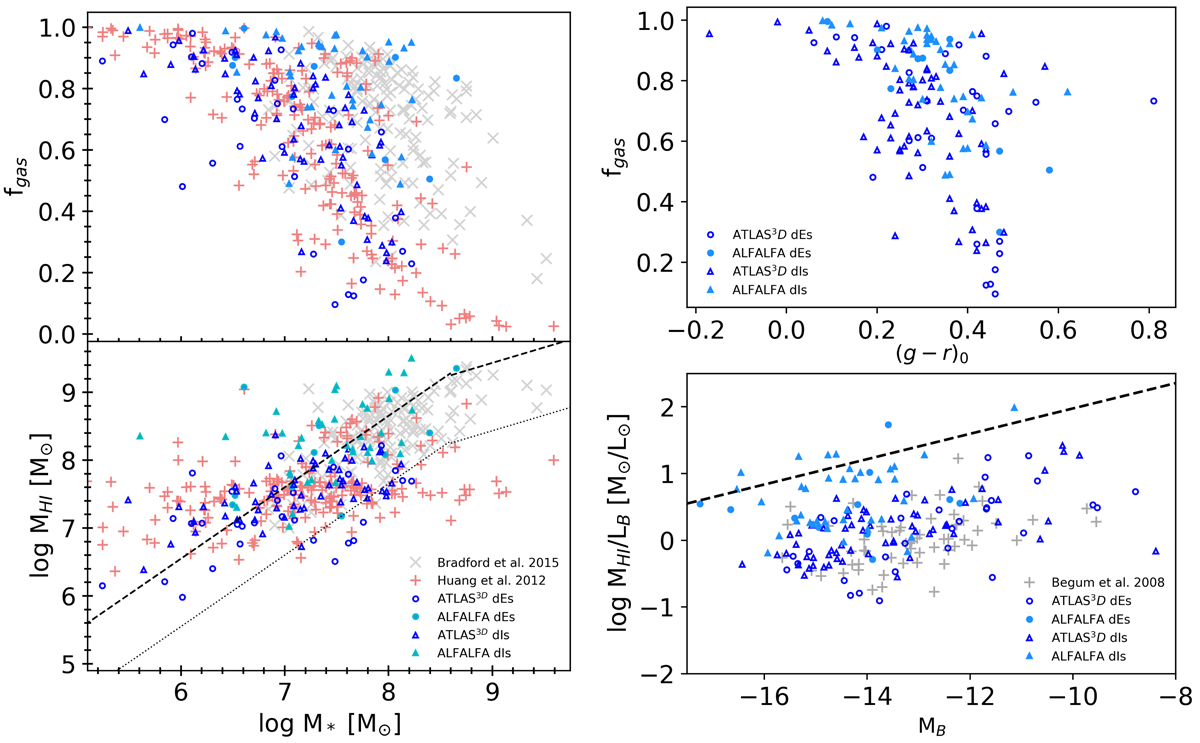
Relations between the HI and optical properties of the dwarf galaxies detected in ATLAS3D HI survey (blue markers) and in ALFALFA (light blue markers) as compared to dwarfs (crosses) from Huang et al. (2012) (red), Bradford et al. (2015) (gray), and Begum et al. (2008a) (gray). We highlight MATLAS dEs with circles and dIs with triangles. Left: gas fraction (top) and log MHI (bottom) as a function of log M*. The relations for galaxies with log(M*/M⊙) < 8.6 and > 8.6 from Bradford et al. (2015) are represented with dashed lines, while the dotted lines identify the differences of −1 dex from these relations. Right: relations between log MHI/LB as a function of MB (bottom) and the gas fraction as a function of (g − r)0 (top). The dashed line shows the upper envelope for the HI mass-to-light ratio at a given luminosity from Warren et al. (2007).
Current usage metrics show cumulative count of Article Views (full-text article views including HTML views, PDF and ePub downloads, according to the available data) and Abstracts Views on Vision4Press platform.
Data correspond to usage on the plateform after 2015. The current usage metrics is available 48-96 hours after online publication and is updated daily on week days.
Initial download of the metrics may take a while.