Fig. 4.
Download original image
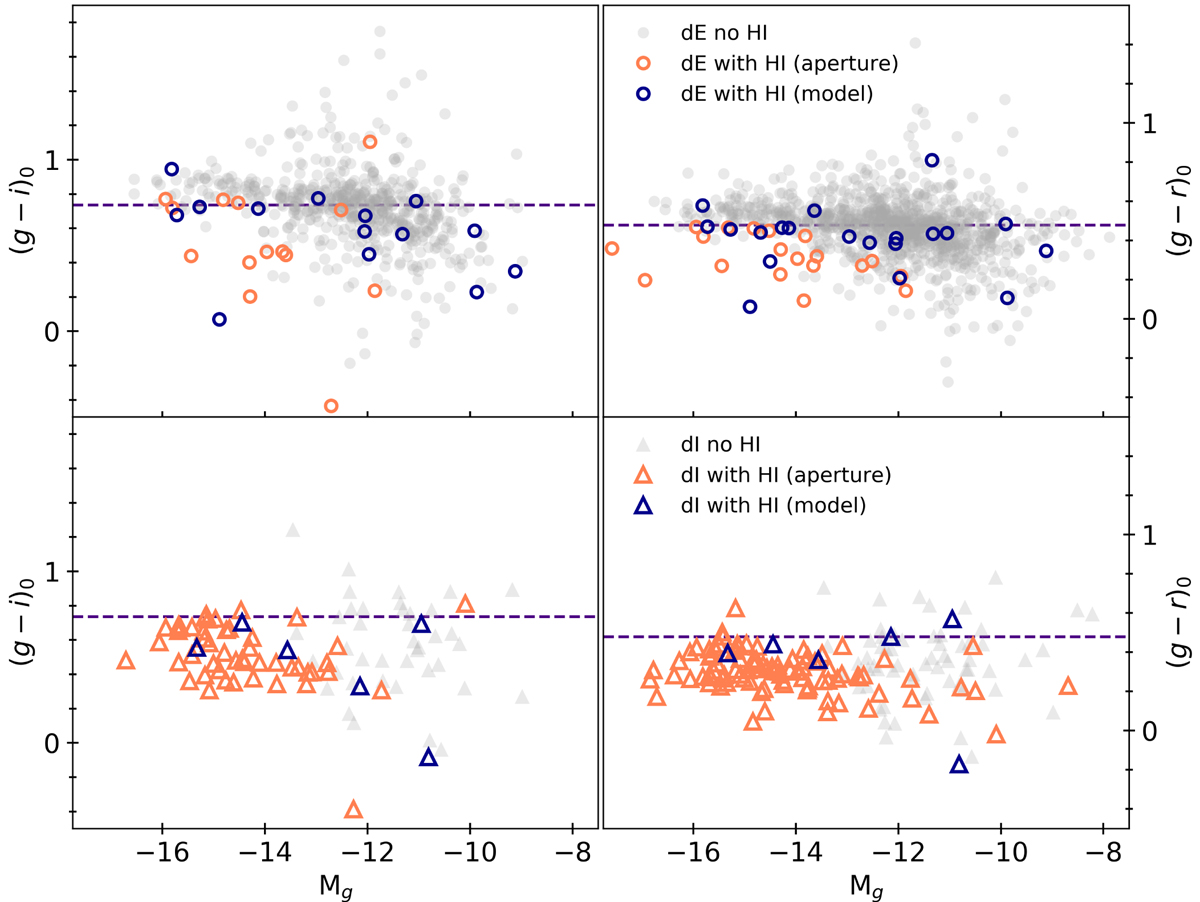
(g − i)0 (left) and (g − r)0 (right) color-magnitude diagrams of the HI MATLAS dwarfs (blue and orange markers) as compared to the ones with no HI detection (gray markers). The colors are computed from GALFIT models (gray and blue markers) and SOURCE EXTRACTOR aperture photometry (orange markers). Dashed lines: median colors of the sample of MATLAS dwarfs with no HI detection. We separate the dwarfs by dE (top, circles) and dI (bottom, triangles) morphology.
Current usage metrics show cumulative count of Article Views (full-text article views including HTML views, PDF and ePub downloads, according to the available data) and Abstracts Views on Vision4Press platform.
Data correspond to usage on the plateform after 2015. The current usage metrics is available 48-96 hours after online publication and is updated daily on week days.
Initial download of the metrics may take a while.