Free Access
Fig. A.1.
Download original image
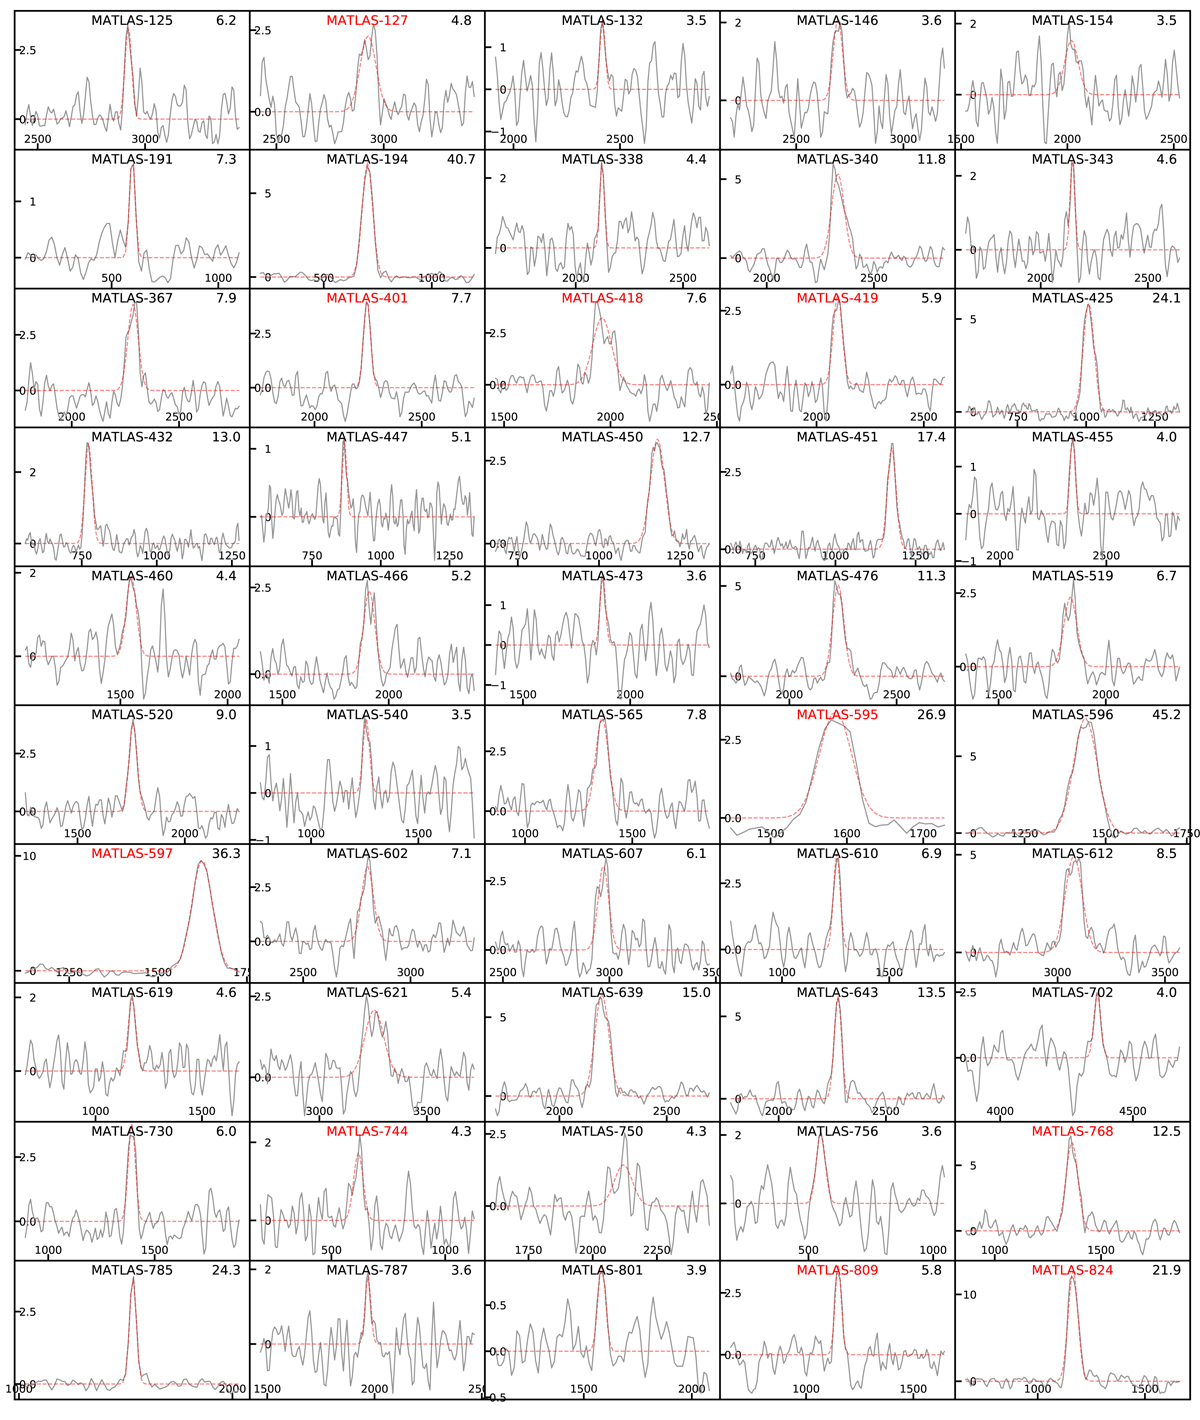
HI line spectra of the 94 detected dwarf galaxies in the ATLAS3D HI survey. The flux is represented in mJy. We overplot the Gaussian fit with a red dashed line. Dwarfs detected in both ATLAS3D and ALFALFA surveys have a red name. We indicate the S/N in the top right corner of each spectrum.
Current usage metrics show cumulative count of Article Views (full-text article views including HTML views, PDF and ePub downloads, according to the available data) and Abstracts Views on Vision4Press platform.
Data correspond to usage on the plateform after 2015. The current usage metrics is available 48-96 hours after online publication and is updated daily on week days.
Initial download of the metrics may take a while.