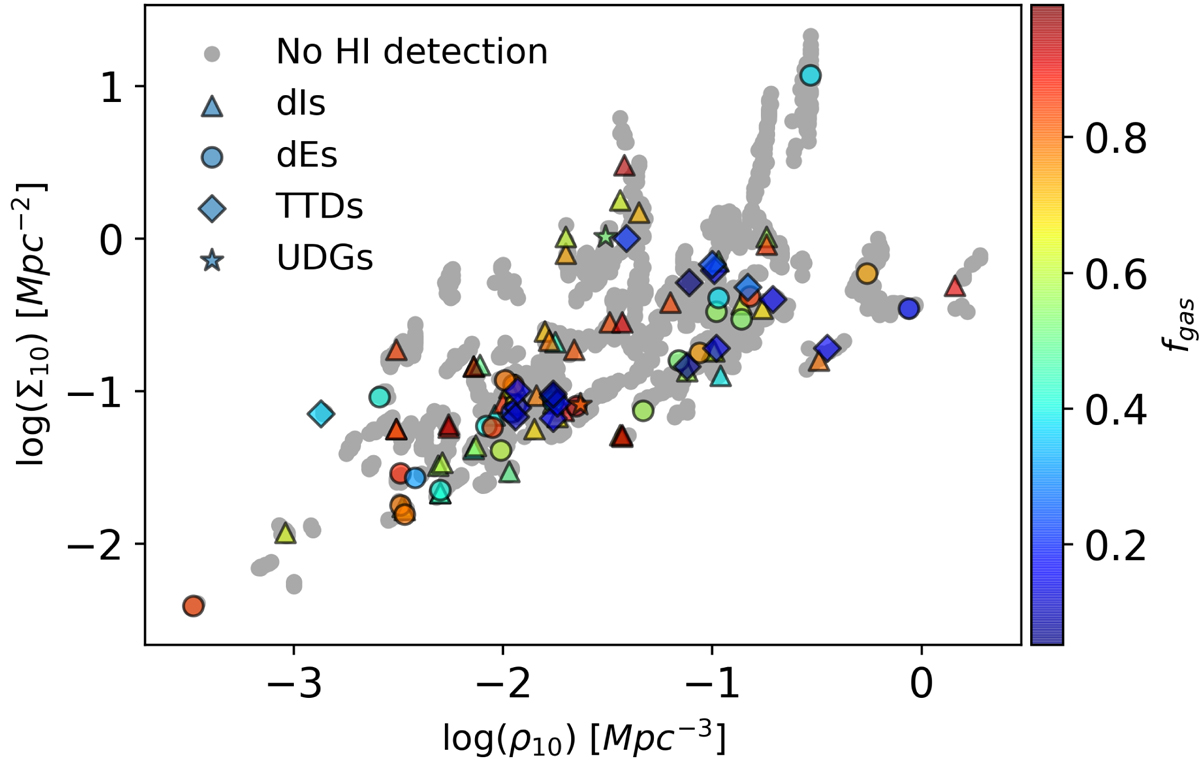
Fig. 11.
Download original image
Local volume density ρ10 as a function of the local surface density Σ10. We illustrate the local densities probed by the MATLAS survey with the dwarfs with no HI detection (gray dots). We show the HI-bearing dwarfs divided per morphology: the most gas-rich dIs with MHI/LB > 1 (triangles), the dEs (circles), the TTDs (diamonds) and the UDGs (stars). We indicate the gas fraction of the HI-bearing dwarfs with the colorbar.
Current usage metrics show cumulative count of Article Views (full-text article views including HTML views, PDF and ePub downloads, according to the available data) and Abstracts Views on Vision4Press platform.
Data correspond to usage on the plateform after 2015. The current usage metrics is available 48-96 hours after online publication and is updated daily on week days.
Initial download of the metrics may take a while.