Fig. 10.
Download original image
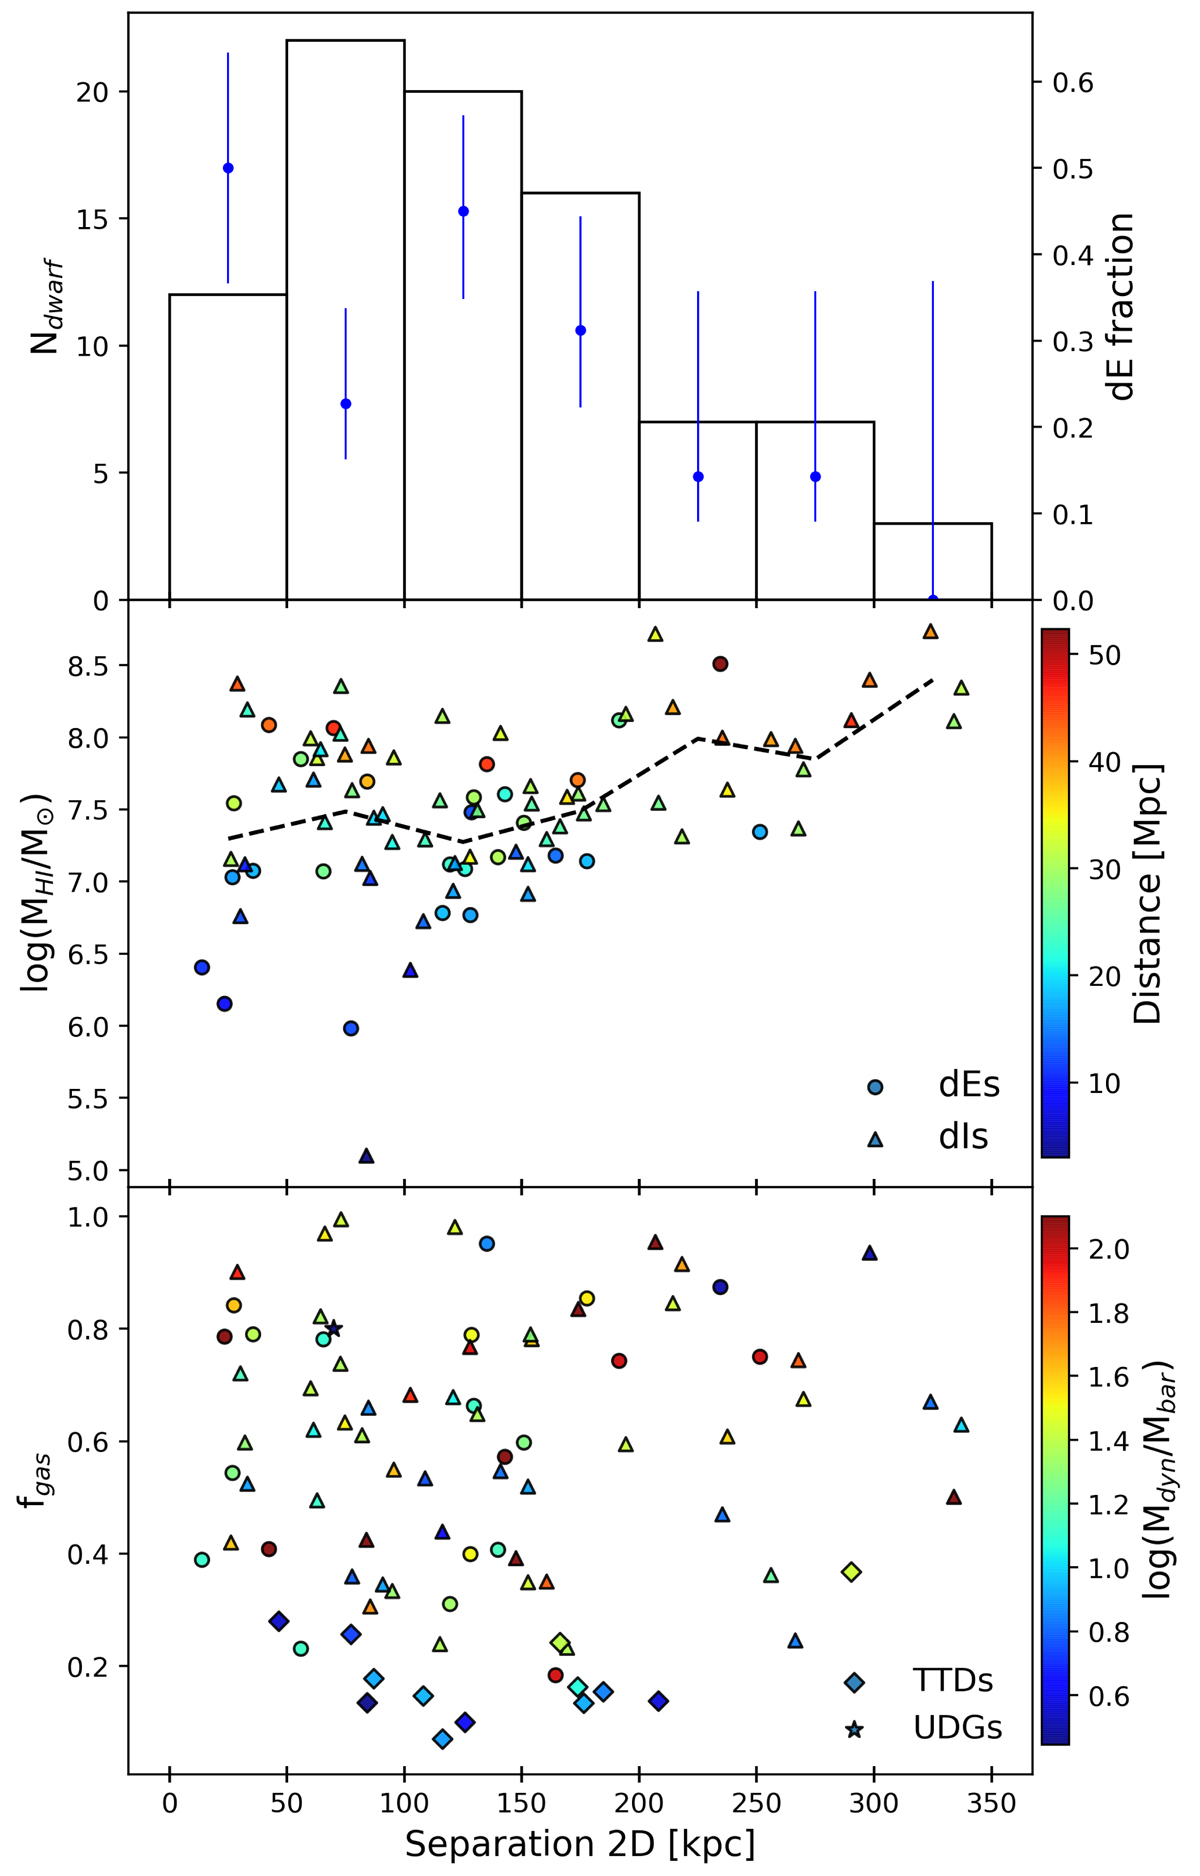
HI-bearing dwarf satellites projected separation from the host for the subsample of 50 ETGs (top) as a function of the HI mass (middle) and gas fraction (bottom). We show the fraction of dEs with blue dots and error bars (top), defined as the 1σ binomial confidence intervals. The colorbars indicate the distance of the dwarf in Mpc (middle) and the dynamical-to-baryonic mass ratio (bottom). The dashed line represents the running average of the HI mass per bin of width 50 kpc (middle). We highlight the dEs with circles, the dIs with triangles, and added the TTDs as diamonds, and UDGs as stars to the bottom plot.
Current usage metrics show cumulative count of Article Views (full-text article views including HTML views, PDF and ePub downloads, according to the available data) and Abstracts Views on Vision4Press platform.
Data correspond to usage on the plateform after 2015. The current usage metrics is available 48-96 hours after online publication and is updated daily on week days.
Initial download of the metrics may take a while.