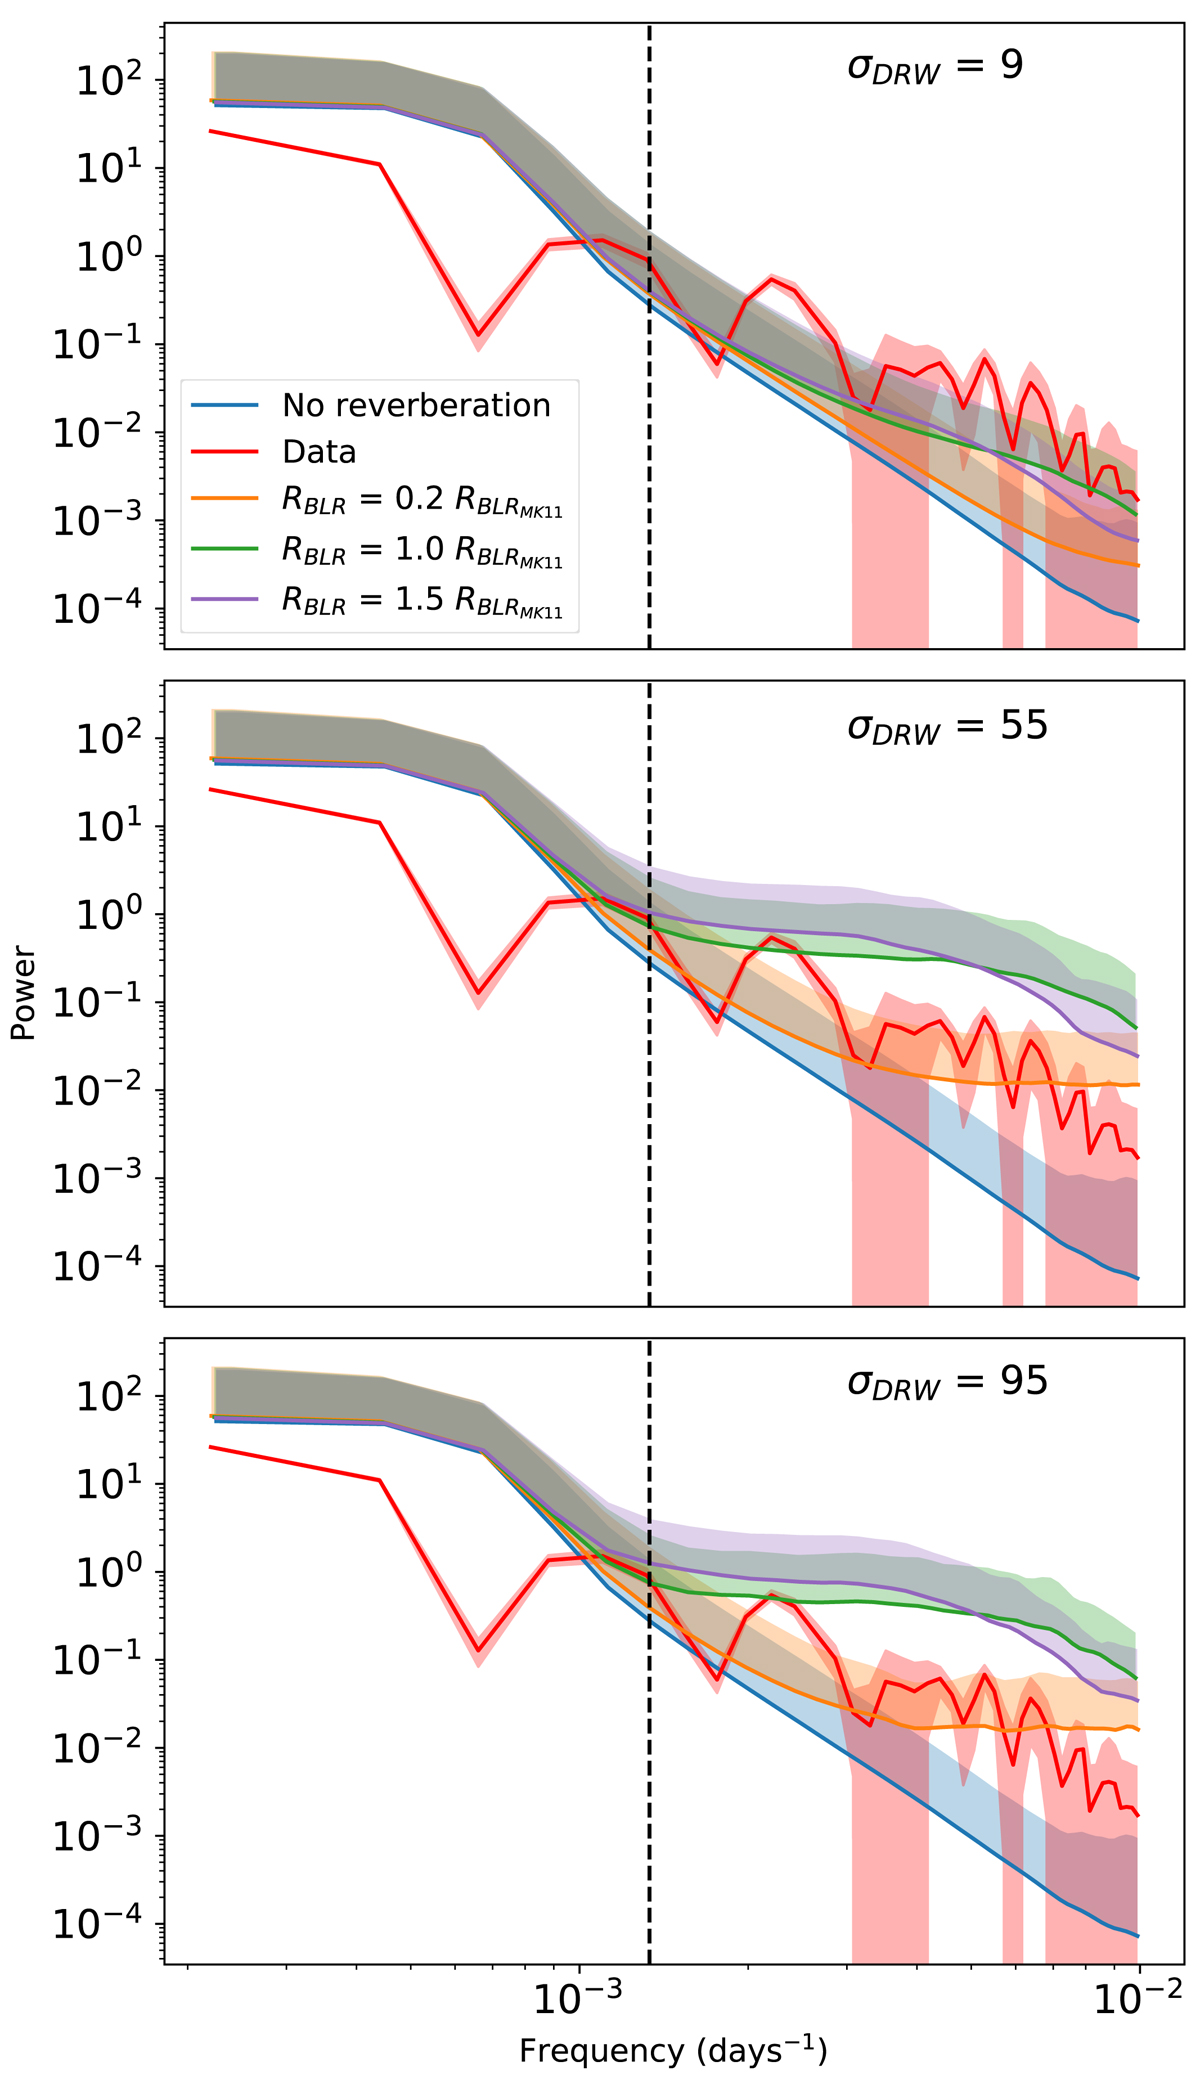
Fig. 9.
Download original image
Effect of the reverberation process on the power spectrum. The data are shown as a solid red line. The coloured envelopes display the power spectra from 100 000 simulated curves for different values of RBLR. Each panel considers different values for σDRW. In this plot we use R0 = RMK11, ⟨M⟩ = 0.3 M⊙, ve = 700 km s−1, and fBLR = 0.432 ± 0.036. The black dashed line marks the boundary between low and high frequency. While the high-frequency range is never well represented with pure microlensing (blue), it is very sensitive to a change in the reverberation parameters.
Current usage metrics show cumulative count of Article Views (full-text article views including HTML views, PDF and ePub downloads, according to the available data) and Abstracts Views on Vision4Press platform.
Data correspond to usage on the plateform after 2015. The current usage metrics is available 48-96 hours after online publication and is updated daily on week days.
Initial download of the metrics may take a while.