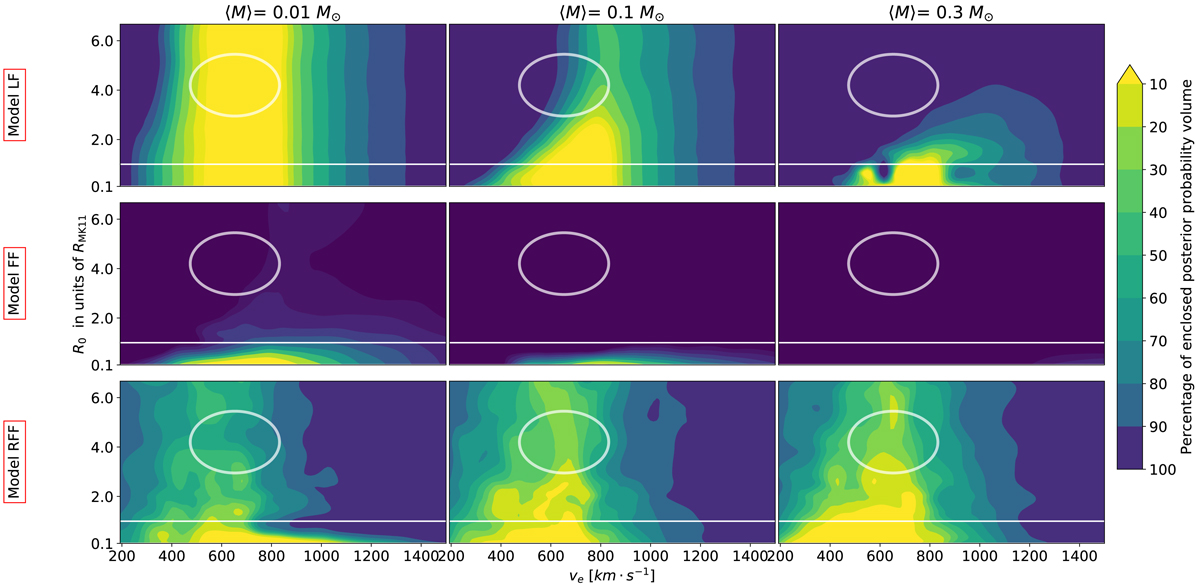
Fig. 8.
Download original image
Slices of the marginalised posterior probability of the (ve, R0, ⟨M⟩) parameter space (three-dimensional after the marginalisation over the angle of ve using Eq. (17)) for each of the three models described in Sect. 4. Model LF: light curves simulated without reverberation and fitted only to the low-frequency data, i.e. up to 1/750 days−1, which corresponds to the same frequency cut as in Morgan et al. (2012). Model FF: same simulations are fitted to the full frequency range, i.e. up to 1/100 days−1. Model RFF: light curves are now simulated with reverberation (fBLR = 0.432 ± 0.036, σDRW = 55 and RBLR = RBLRMK11) and the full observed frequency range up to 1/100 days−1 is considered. The solid line corresponds to RMK11, the estimate of Mosquera & Kochanek (2011), the ellipse represents the (ve, R0) measurement interval from Morgan et al. (2012). The coloured contours encapsulate [10–100]% of the probability volume and are projected in each of the displayed slices. We note that our probability densities are not scaled by the evidence and therefore cannot be compared across different models.
Current usage metrics show cumulative count of Article Views (full-text article views including HTML views, PDF and ePub downloads, according to the available data) and Abstracts Views on Vision4Press platform.
Data correspond to usage on the plateform after 2015. The current usage metrics is available 48-96 hours after online publication and is updated daily on week days.
Initial download of the metrics may take a while.