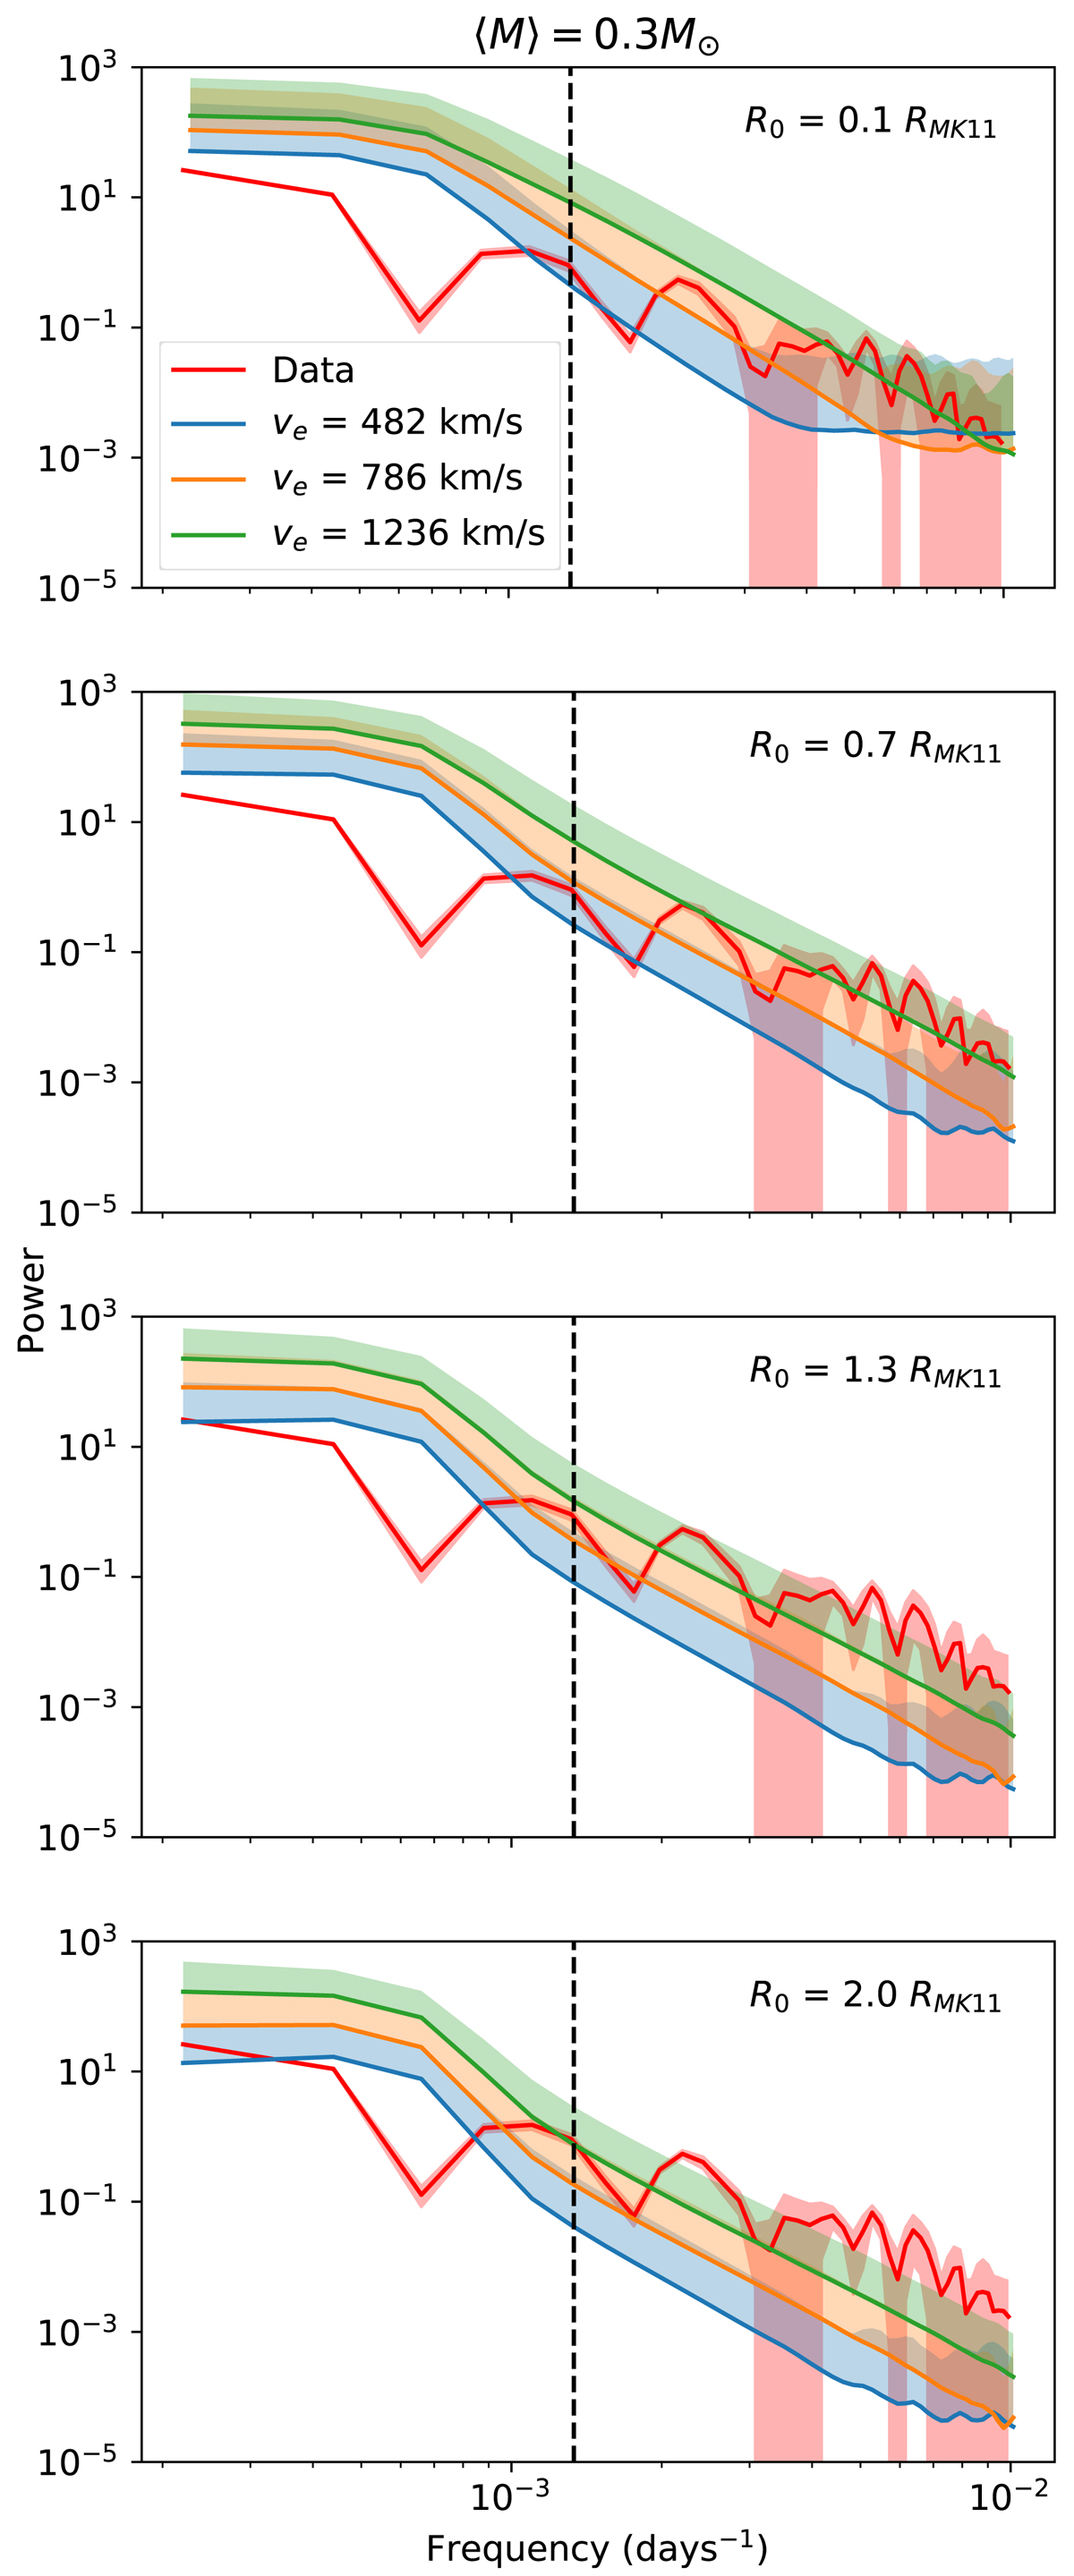
Fig. 7.
Download original image
Mean (lines) and upper 1−σ envelope (shaded area) of power spectra from 100 000 simulated curves for different (ve, R0) configurations, in the absence of reverberation (FBLR = 0 in Eq. (3)), compared to the data (same as Fig. 4). Due to the logarithmic scale, the lower envelopes extend almost to the x-axis and are not displayed for clarity. The vertical dashed line marks the boundary between low and high frequency.
Current usage metrics show cumulative count of Article Views (full-text article views including HTML views, PDF and ePub downloads, according to the available data) and Abstracts Views on Vision4Press platform.
Data correspond to usage on the plateform after 2015. The current usage metrics is available 48-96 hours after online publication and is updated daily on week days.
Initial download of the metrics may take a while.