Fig. 10.
Download original image
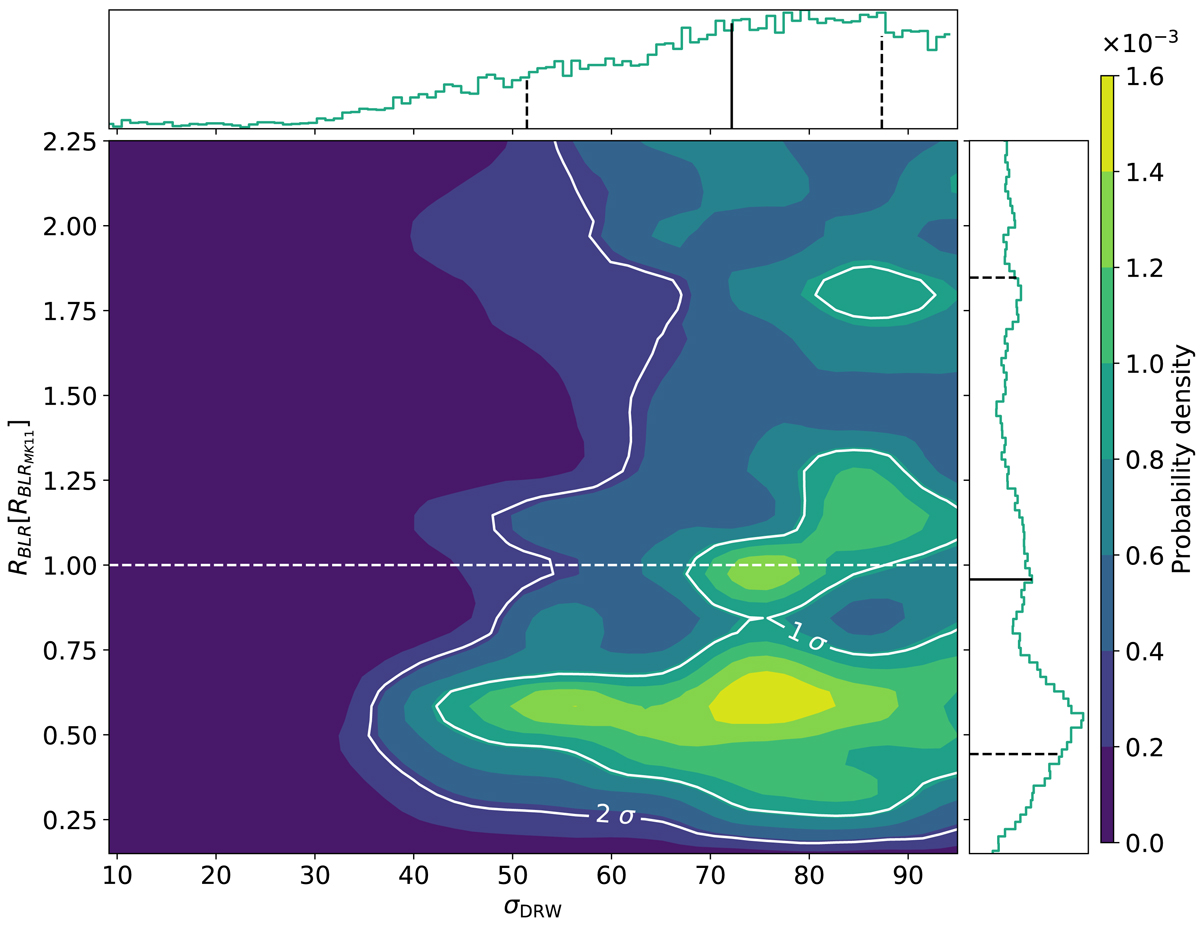
Posterior probability density in the (σDRW, RBLR) parameter space marginalised over the microlensing parameters given ⟨M⟩ = 0.3 M⊙. RBLR is given in units of RBLRMK11 = 1.71 × 1017 cm, indicated by the white dashed line. The contours correspond to the 1 and 2−σ confidence intervals. Marginalised probability distributions of σDRW and RBLR are given in the top and right histograms respectively. In each histogram, the black line shows the 50th percentile (median value) of the distribution and the dashed lines highlight the 16th and 84th percentiles. Hence, we obtain ![]() and
and ![]() cm.
cm.
Current usage metrics show cumulative count of Article Views (full-text article views including HTML views, PDF and ePub downloads, according to the available data) and Abstracts Views on Vision4Press platform.
Data correspond to usage on the plateform after 2015. The current usage metrics is available 48-96 hours after online publication and is updated daily on week days.
Initial download of the metrics may take a while.