Free Access
Fig. 1
Download original image
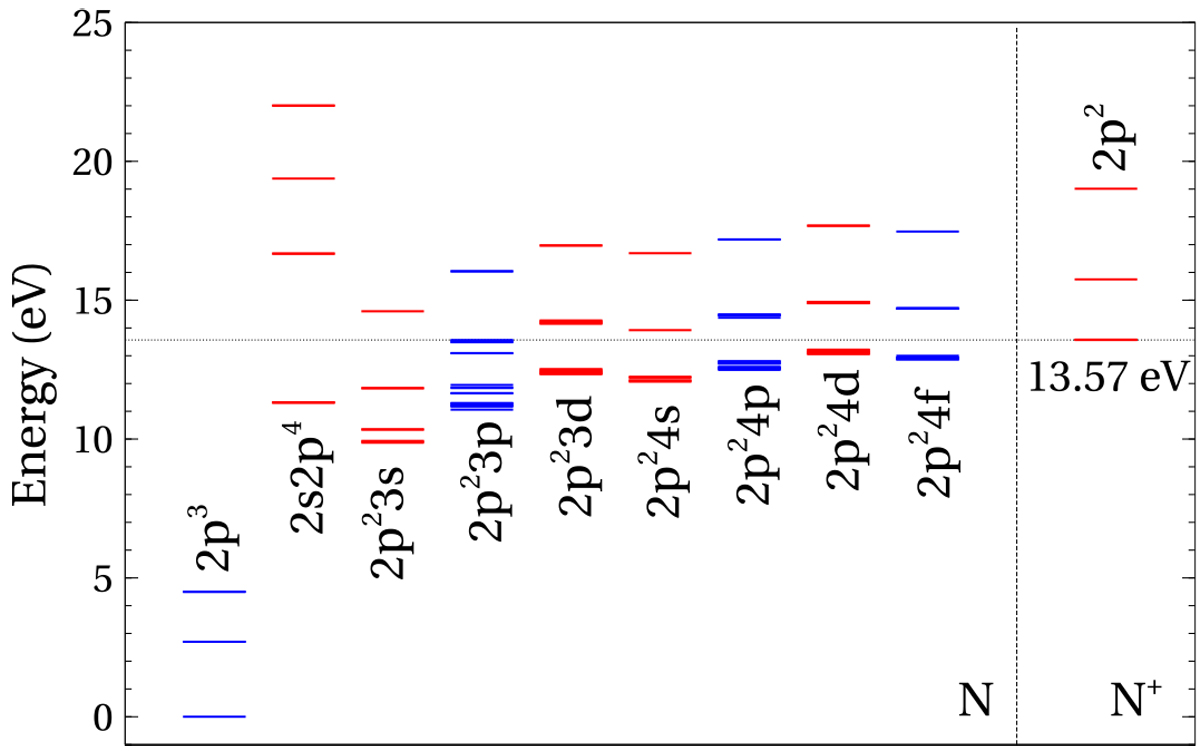
Energy levels of the N atom and N+ ion. The single ionization threshold is shown by the horizontal line. Even-parity configurations are presented by red lines and odd-parity configurations are shown by blue lines.
Current usage metrics show cumulative count of Article Views (full-text article views including HTML views, PDF and ePub downloads, according to the available data) and Abstracts Views on Vision4Press platform.
Data correspond to usage on the plateform after 2015. The current usage metrics is available 48-96 hours after online publication and is updated daily on week days.
Initial download of the metrics may take a while.