Fig. 9
Download original image
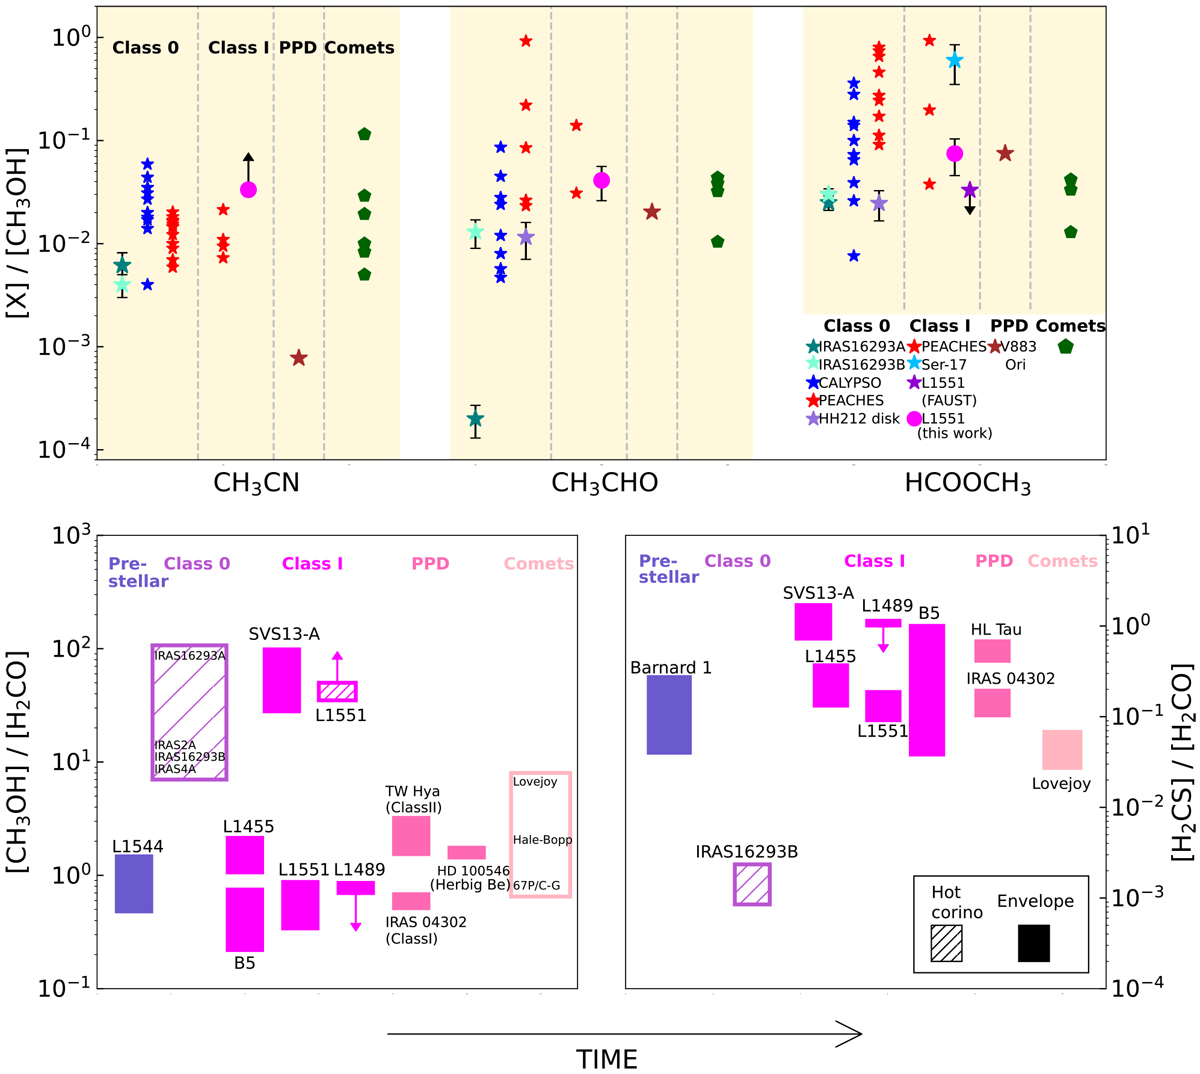
Abundance ratios of organic molecules towards the four protostars. Upper panel: abundance ratios of iCOMs with respect to methanol measured at different evolutionary stages. The three panels (from left to right) refer to CH3CN, CH3CHO, and HCOOCH3, and each is divided into four parts; the gray dashed lines separate the Class 0 sources, Class I sources, protoplanetary disks (PPD), and comets. The abundance ratios estimated for L1551-IRS5 in this work are indicated by a magenta circle. The abundance ratios for the literature sources (see text for references) are labeled in the legend in the bottom right corner. Bottom panels: abundance ratios of [CH3OH]/[H2CO] (left) and [H2CS]/[H2CO] (right) for our Class I sources (magenta bars) compared with the values of prestellar cores, Class 0 sources, PPDs, and comets from the literature, as labeled. The dashed bar in the left panel indicates hot corino measurements, while the dashed bar in the right panel indicates the measurement obtained in the inner 60 au towards the IRAS 16293B protostar. The references of the measurements from the literature are reported in Sect. 5.3.2.
Current usage metrics show cumulative count of Article Views (full-text article views including HTML views, PDF and ePub downloads, according to the available data) and Abstracts Views on Vision4Press platform.
Data correspond to usage on the plateform after 2015. The current usage metrics is available 48-96 hours after online publication and is updated daily on week days.
Initial download of the metrics may take a while.