Fig. 7
Download original image
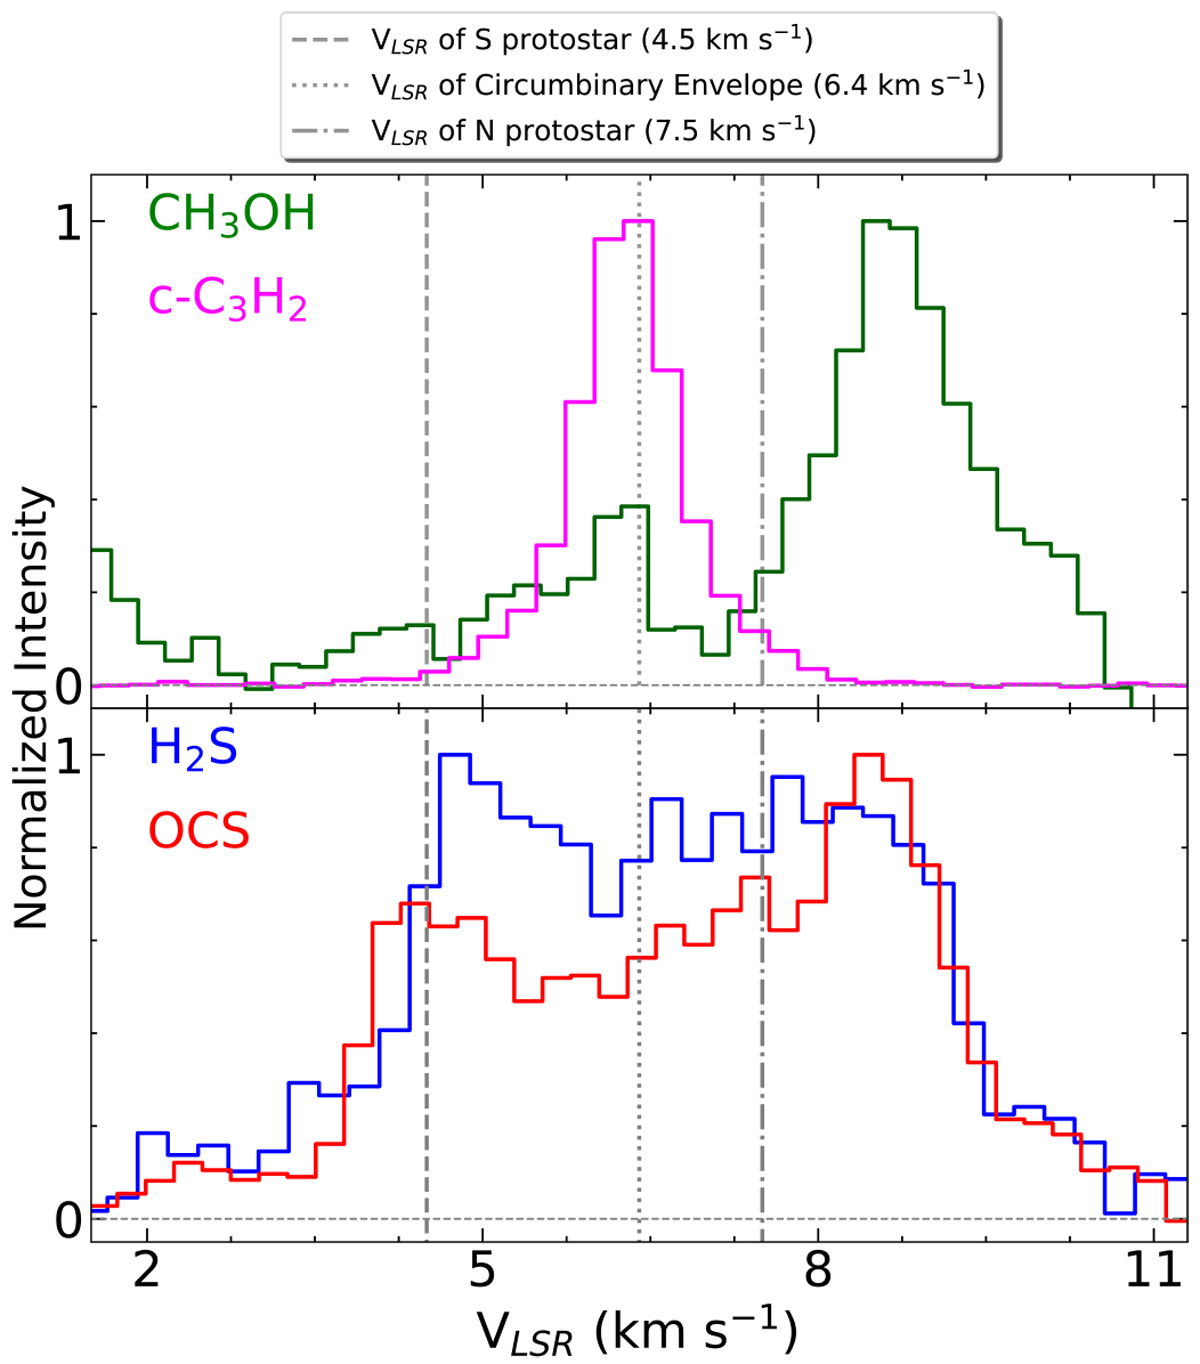
Normalized intensity profiles of four species towards L1551-IRS5. The spectra of CH3OH in green and c-C3H2 in pink in the upper panel are obtained after stacking the detected transitions (see Fig. 5). The spectra of H2S in blue and OCS in red in the lower panel are transitions 22,0–21,1 and 19–18, respectively (see Fig. A.4). The dashed and dash-dotted lines represent the systemic velocities of the southernprotostar (4.5 km s−1) and the northern protostar (7.5 km s−1), respectively (Bianchi et al. 2020), while the dotted line represents the systemic velocity of the circumbinary envelope (6.4 km s−1) measured using the C18O 2–1 line (this work).
Current usage metrics show cumulative count of Article Views (full-text article views including HTML views, PDF and ePub downloads, according to the available data) and Abstracts Views on Vision4Press platform.
Data correspond to usage on the plateform after 2015. The current usage metrics is available 48-96 hours after online publication and is updated daily on week days.
Initial download of the metrics may take a while.