Fig. 4
Download original image
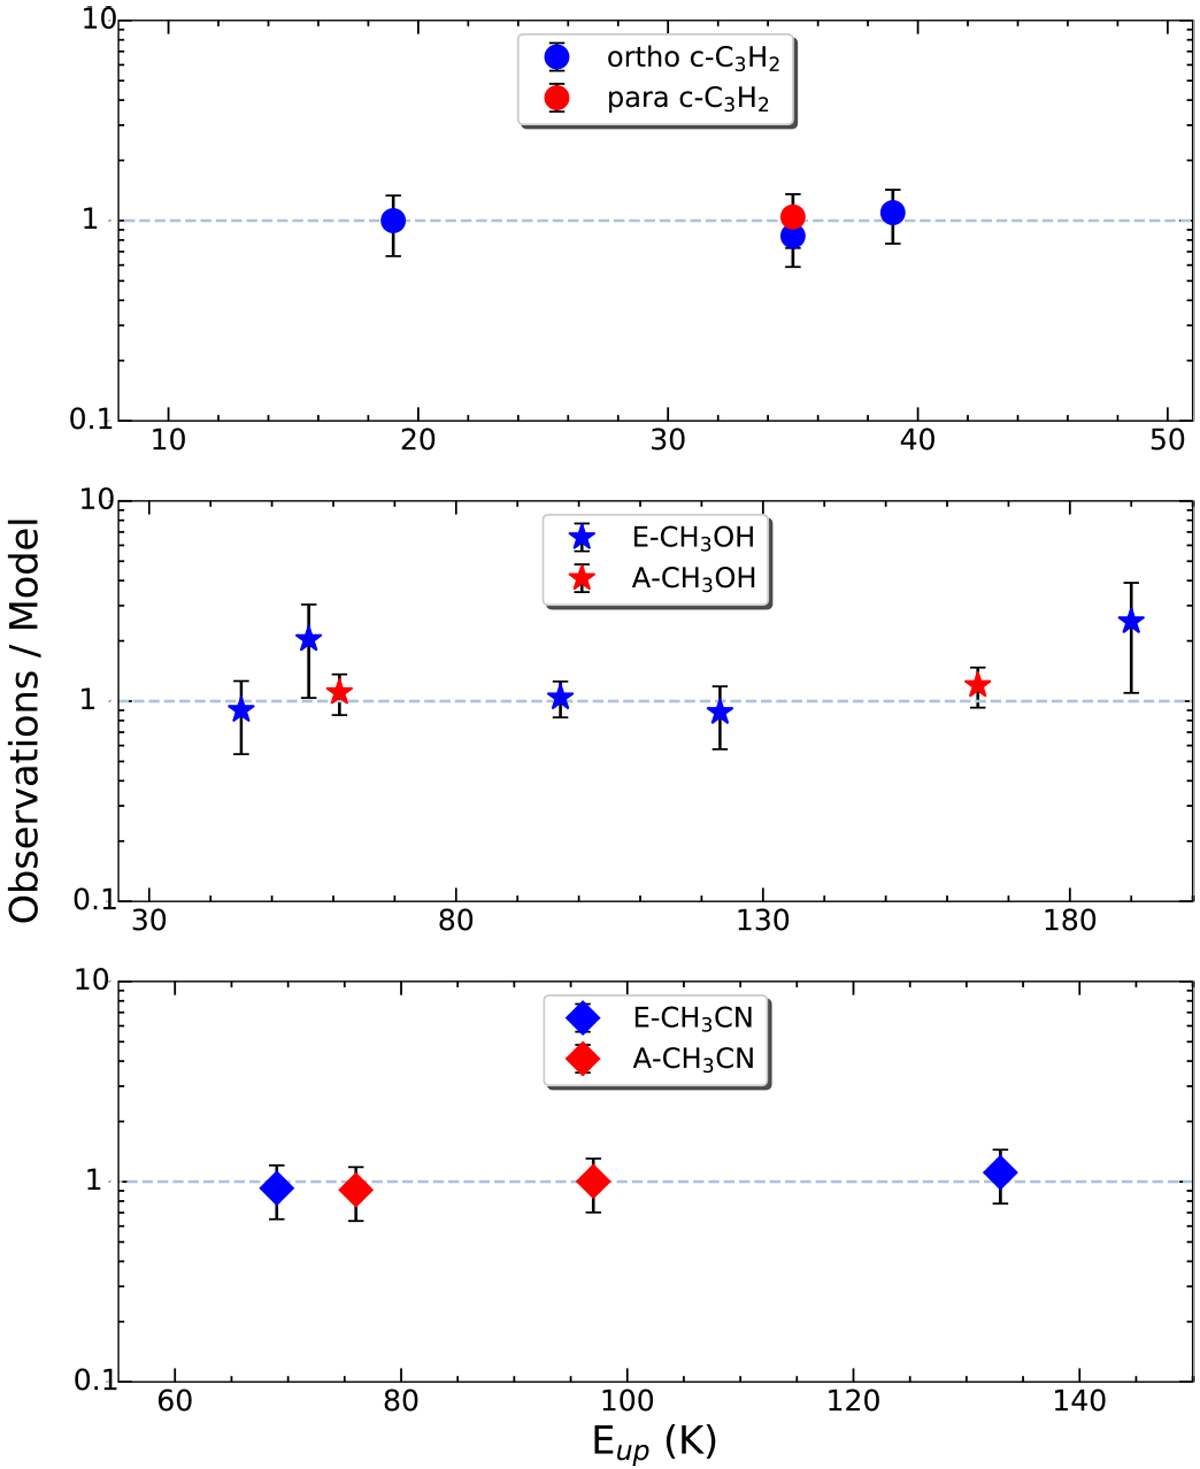
Ratios of the observed line intensities to those predicted by the best-fitting LVG models as a function of upper level energy of the considered transitions towards L1551-IRS5. Upper panel: blue and red circles are for the ortho and para c-C3H2, respectively. Middle panel: Blue and red stars show the E and A transitions of CH3OH, respectively. Bottom panel: blue and red diamonds are for the E and A CH3CN lines, respectively.
Current usage metrics show cumulative count of Article Views (full-text article views including HTML views, PDF and ePub downloads, according to the available data) and Abstracts Views on Vision4Press platform.
Data correspond to usage on the plateform after 2015. The current usage metrics is available 48-96 hours after online publication and is updated daily on week days.
Initial download of the metrics may take a while.