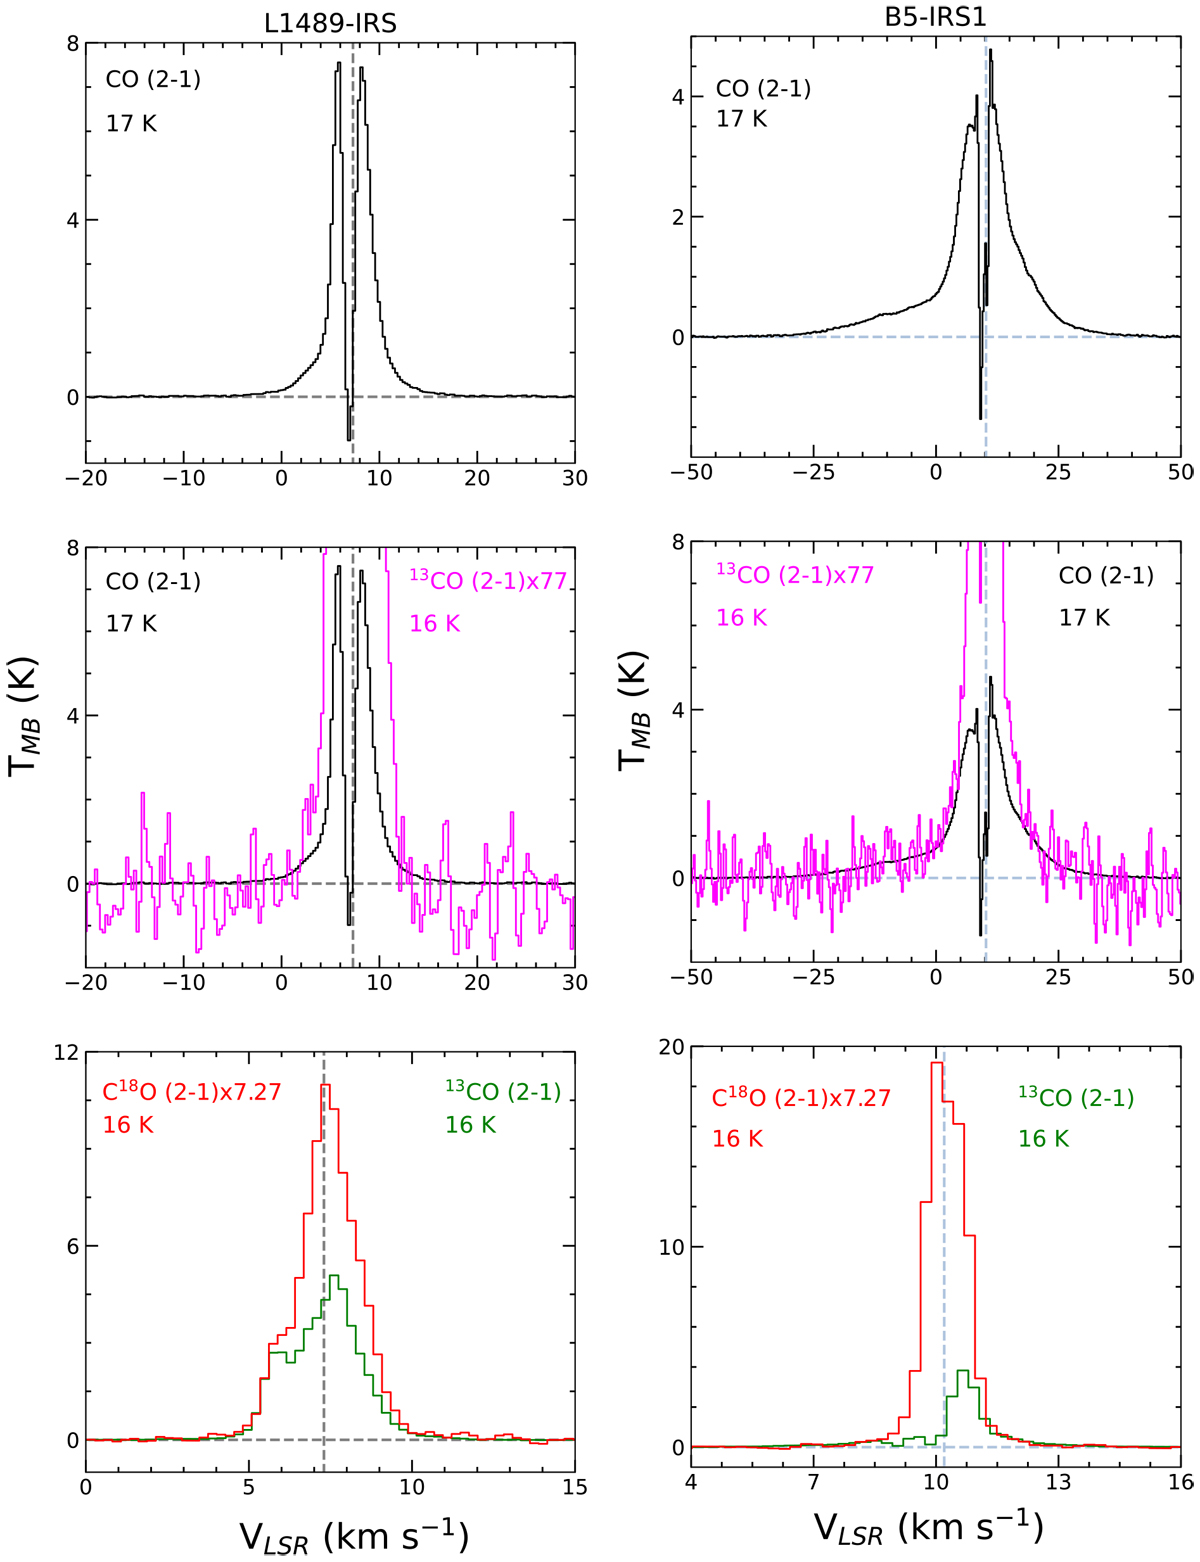
Fig. A.5
Download original image
Observed spectra of CO isotopologues (in TMB scale) towards L1489-IRS (left column) and B5-IRS1 (right column). Species, transition, and upper level energy are reported in each panel. For the panels in the left column the vertical dashed lines stand for the source systemic velocity as measured using C18O (2-1) emission (+7.3 km s−1). For the panels in the right column the vertical dashed lines stand for the source systemic velocity measured using C18O (2-1) emission (+10.2 km s−1). Top panels: CO (2-1) transition. Middle panels: Zoom-in on the CO (2-1) line wings (in black) and the 13CO (2-1) line wings (in magenta), scaled by a factor of 77 in the TMB range from -2 K to 2.5 K. Bottom panels: 13CO (in green) and C18O (in red) scaled by a factor of 7.27 assuming isotopic ratios of 12C/13C = 77 and 16O/18O = 560 (Milam et al. 2005).
Current usage metrics show cumulative count of Article Views (full-text article views including HTML views, PDF and ePub downloads, according to the available data) and Abstracts Views on Vision4Press platform.
Data correspond to usage on the plateform after 2015. The current usage metrics is available 48-96 hours after online publication and is updated daily on week days.
Initial download of the metrics may take a while.