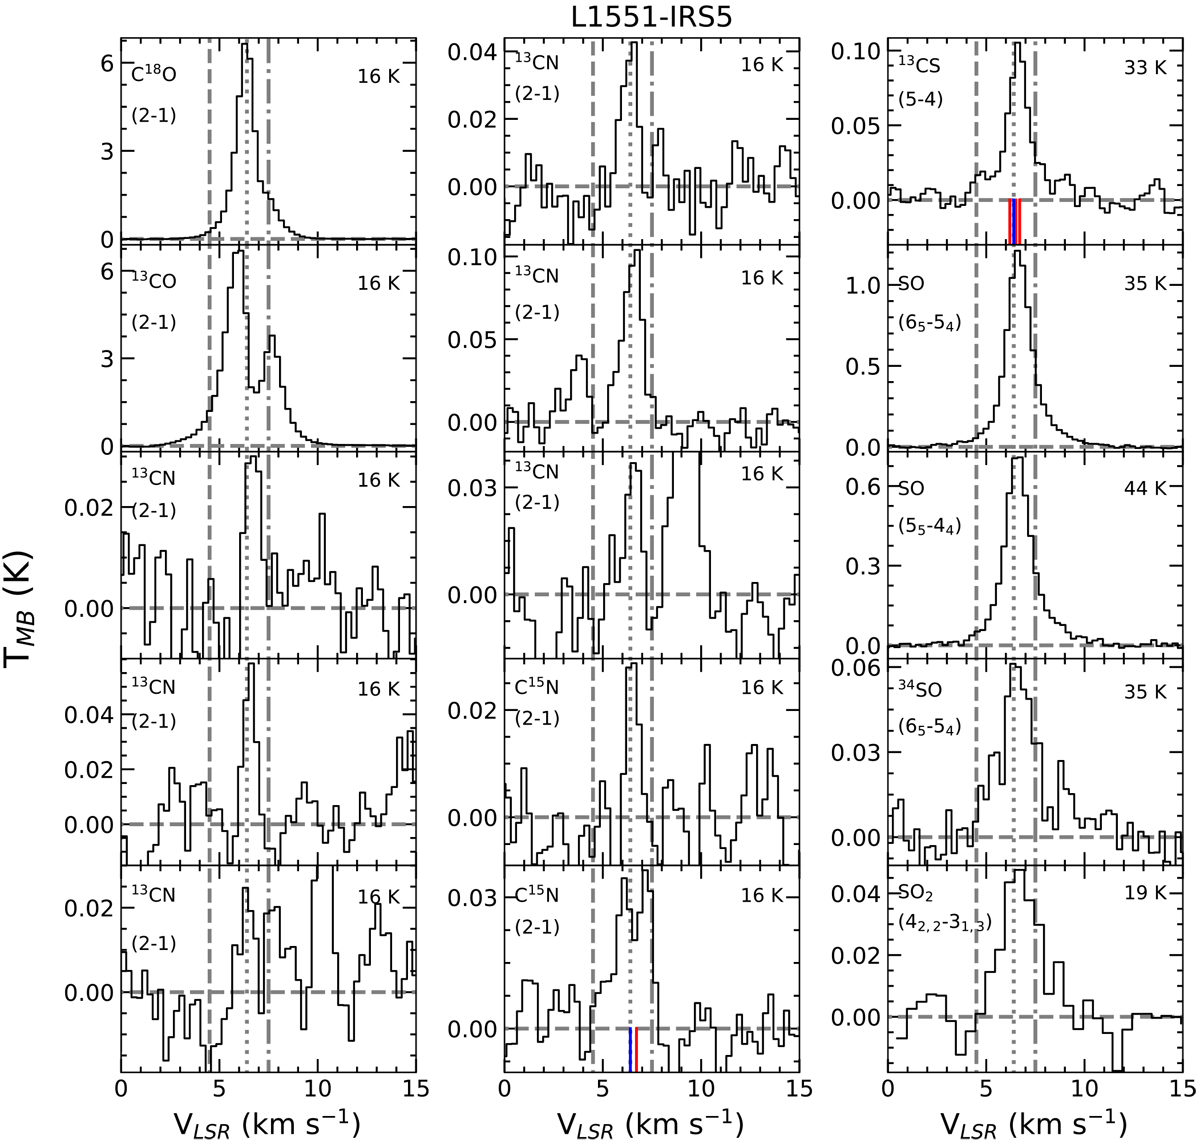
Fig. A.4
Download original image
Spectra observed towards L1551-IRS5 (see Table A.4 in TMB scale). Species, transition, and upper level energy are reported in each panel. The vertical dotted line stands for the source systemic velocity as measured using the C18O(2–1) line (+6.4 km s−1). The vertical dashed line and the vertical dash-dotted line stand for the systemic velocities of the binary system associated with the southern source (+4.5 km s−1) and northern source (+7.5 km s−1), respectively. In the 13CS(5–4) spectrum the velocity scale is centered on the brightest (38 D2) hyperfine component (vertical blue line) at 231220.7 MHz; the vertical red lines indicate the offset in velocity of the fainter components (21 D2 at 231220.7 MHz; 17 D2 at 231220.6 MHz; 1 D2 at 231220.5 MHz). In the C15N(2–1) spectrum (lower panel) the velocity scale is centered on the brightest (6 D2) hyperfine component (vertical blue line) at 219934.8 MHz; the vertical red lines indicate the offset in velocity of the fainter components (4 D2 at 219934.0 MHz).
Current usage metrics show cumulative count of Article Views (full-text article views including HTML views, PDF and ePub downloads, according to the available data) and Abstracts Views on Vision4Press platform.
Data correspond to usage on the plateform after 2015. The current usage metrics is available 48-96 hours after online publication and is updated daily on week days.
Initial download of the metrics may take a while.