Fig. A.2
Download original image
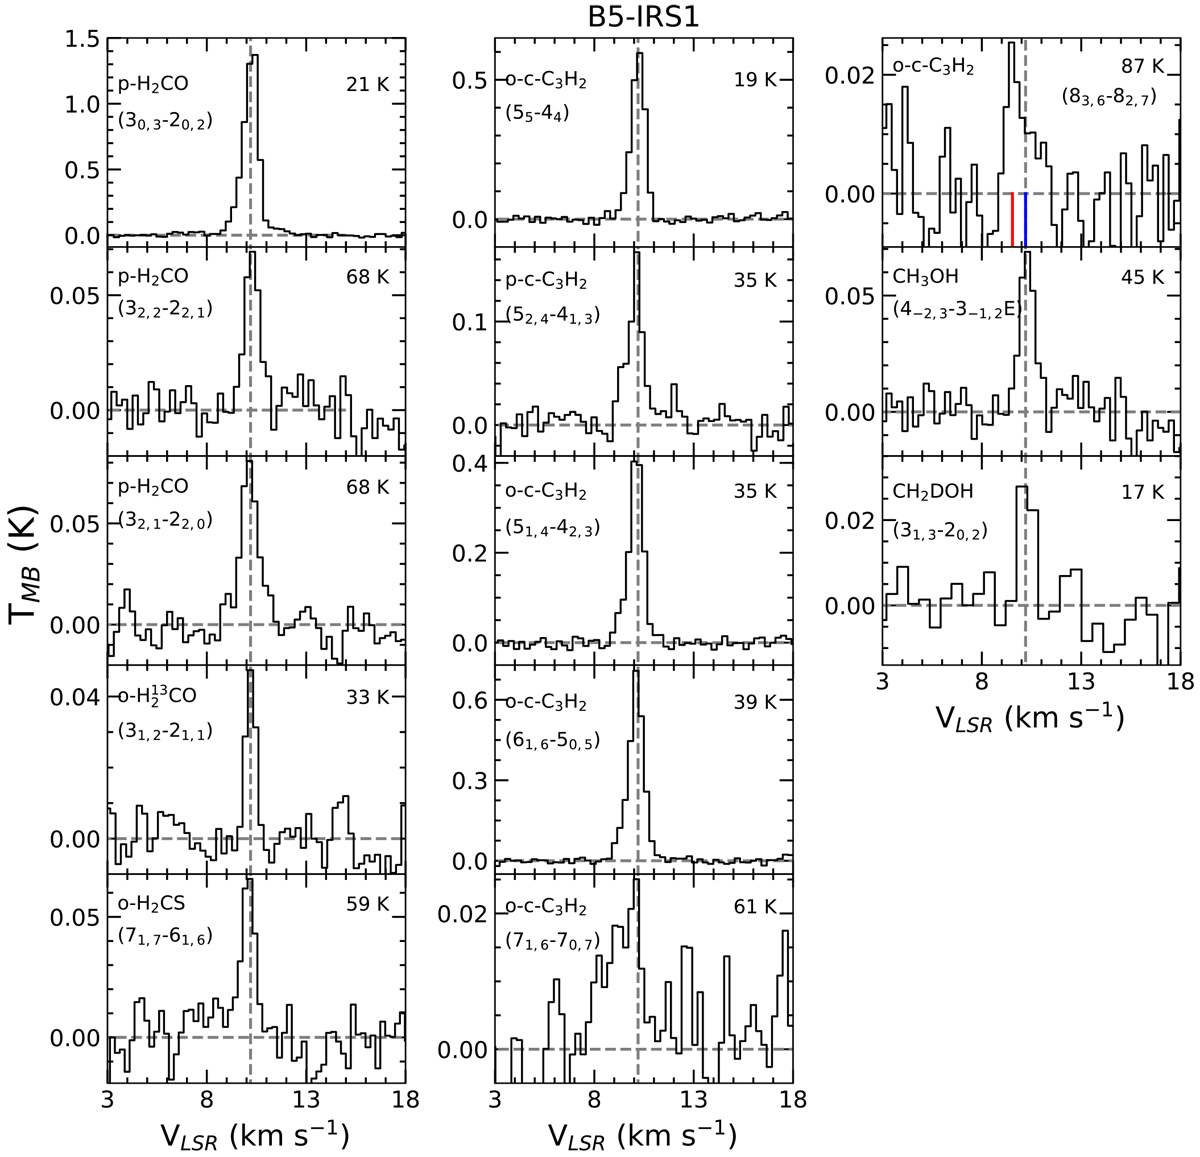
Continued: Spectra observed towards B5-IRS1 (see Table A.2 in TMB scale). In theo- c-C3H2 spectrum the velocity scale is centered on the brightest (63 D2) hyperfine component (vertical blue line) at 218449.4 MHz; the vertical red line indicates the offset in velocity of the fainter components (21 D2 at 216448.8 MHz). The CH2DOH spectrum is smoothed to 0.40 MHz.
Current usage metrics show cumulative count of Article Views (full-text article views including HTML views, PDF and ePub downloads, according to the available data) and Abstracts Views on Vision4Press platform.
Data correspond to usage on the plateform after 2015. The current usage metrics is available 48-96 hours after online publication and is updated daily on week days.
Initial download of the metrics may take a while.