Free Access
Fig. 1
Download original image
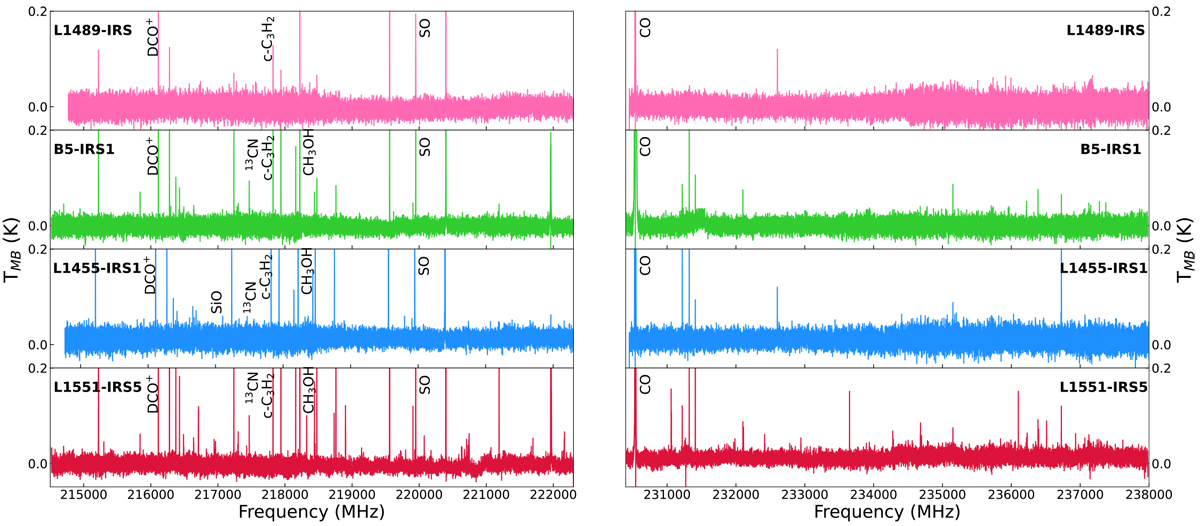
Spectra observed in the 214 500–222 200 MHz and 230 200–238 000 MHz range towards L1489–IRS, B5–IRS1, L1455–IRS1, and L1551–IRS5, ordered from top to bottom according to the number of detected lines (see Table 4). Labels of selected detected species (see Sect. 4.1, Figs. A.1–A.4, and Tables A.1–A.4) are reported.
Current usage metrics show cumulative count of Article Views (full-text article views including HTML views, PDF and ePub downloads, according to the available data) and Abstracts Views on Vision4Press platform.
Data correspond to usage on the plateform after 2015. The current usage metrics is available 48-96 hours after online publication and is updated daily on week days.
Initial download of the metrics may take a while.