Fig. 9.
Download original image
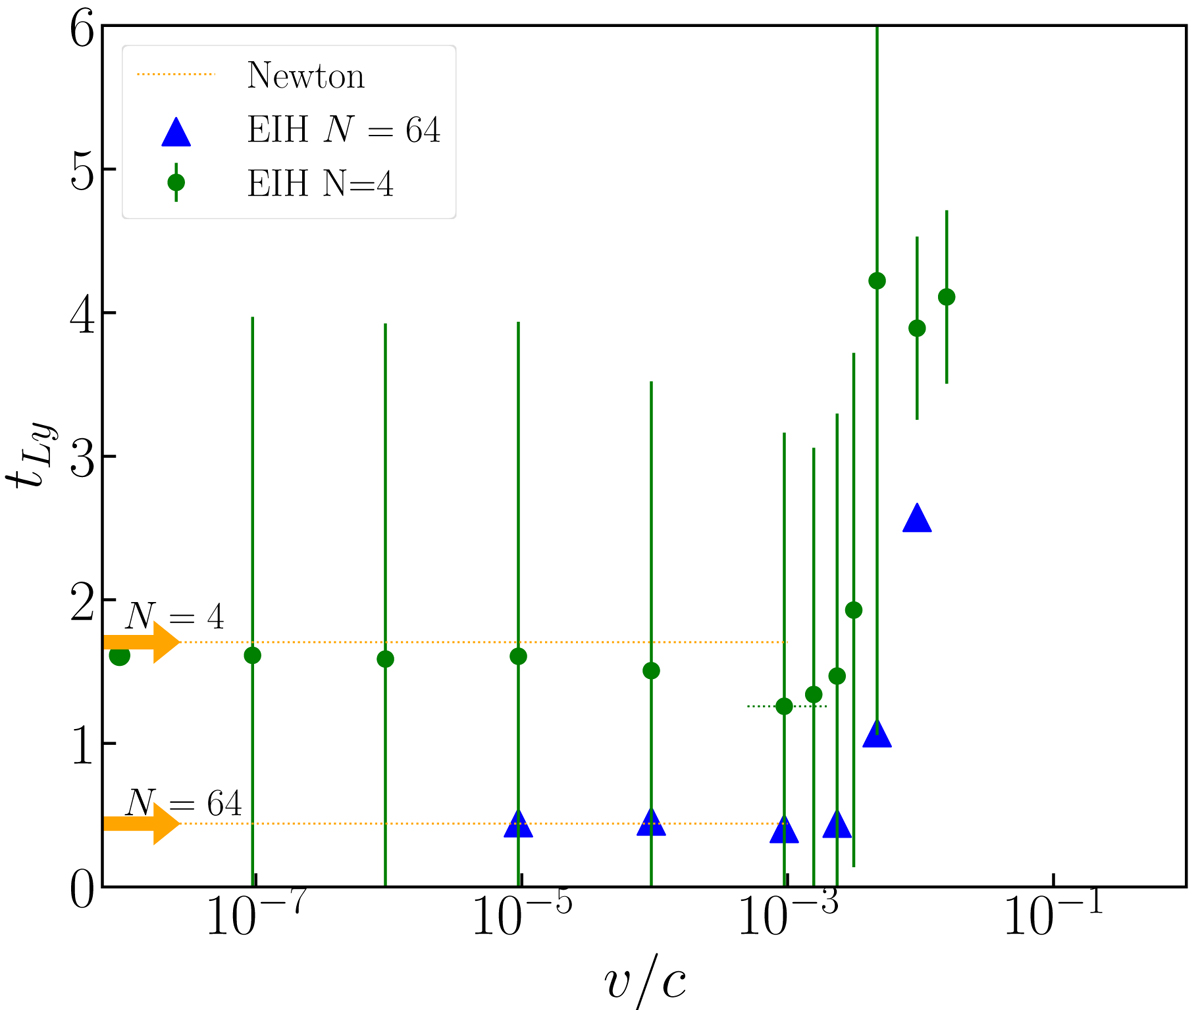
Lyapunov timescale as a function of v/c for N = 4 (green) and N = 64 (blue). The Newtonian case (run with ph4) is presented as arrows in orange. The vertical bars, only for the green points, indicate the dispersion in the simulation results. The short horizontal dotted green line indicates the lowest value for the Lyapunov timescale reached for v/c = 10−3 for N = 4.
Current usage metrics show cumulative count of Article Views (full-text article views including HTML views, PDF and ePub downloads, according to the available data) and Abstracts Views on Vision4Press platform.
Data correspond to usage on the plateform after 2015. The current usage metrics is available 48-96 hours after online publication and is updated daily on week days.
Initial download of the metrics may take a while.