Fig. 6.
Download original image
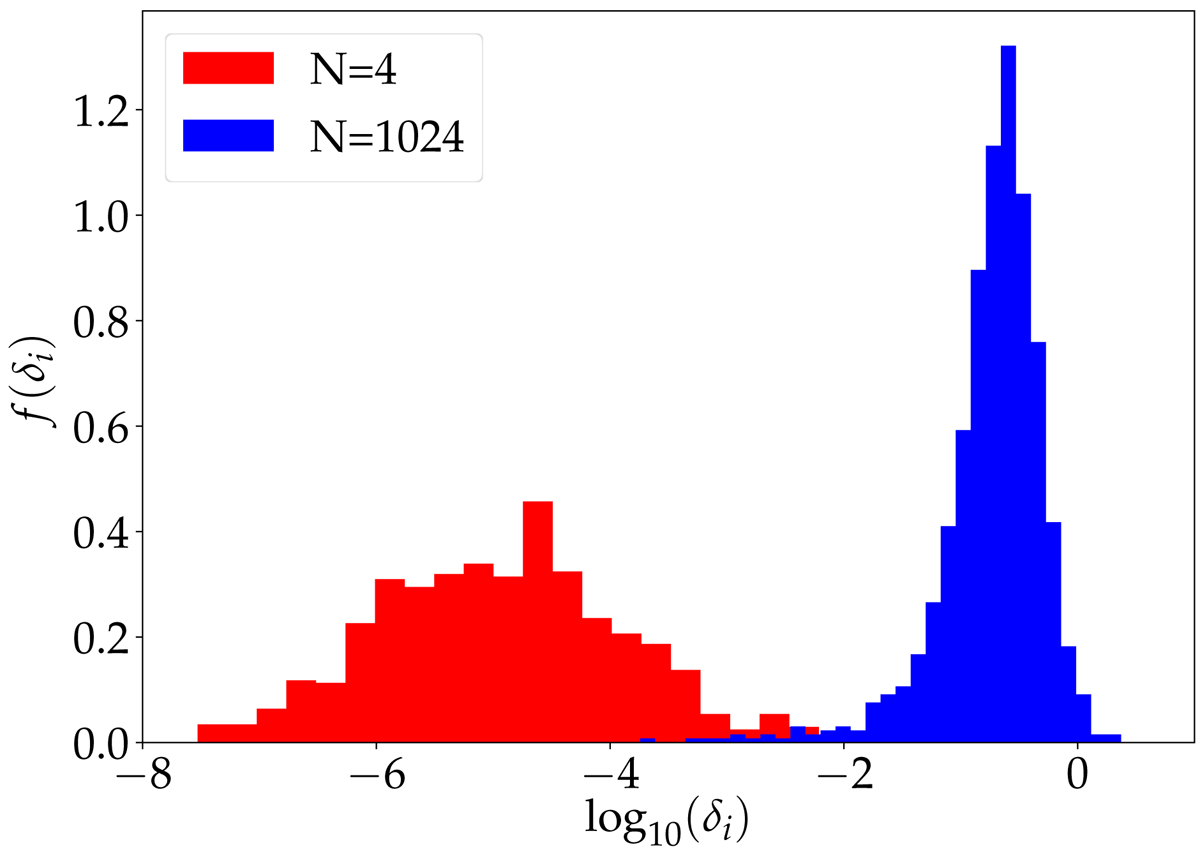
Distribution of phase-space distances for individual particles δi in the simulations with N = 4 (red) and those with N = 1024 (blue) after integrating for t = 10 N-body time units. The data for N = 4 are the result of 200 runs. For N = 1024, we adopted the run used in Fig. 5. Calculations were performed using Brutus until the solution was converged.
Current usage metrics show cumulative count of Article Views (full-text article views including HTML views, PDF and ePub downloads, according to the available data) and Abstracts Views on Vision4Press platform.
Data correspond to usage on the plateform after 2015. The current usage metrics is available 48-96 hours after online publication and is updated daily on week days.
Initial download of the metrics may take a while.